| |

|
|
New analysis · Greater Sydney industrial
Power is no longer just infrastructure.
It’s a pricing input.
As data centres compete for large, well-serviced sites, Western Sydney precincts with high-capacity power are repricing — and the effect reaches well past the data centres themselves.
|
|
|
For years industrial value came down to land, labour, transport and access to customers. In parts of Western Sydney a new variable is moving the price: electricity.
We analysed independently verified Greater Sydney land and building transactions from 2021 to 2026. Land sales were limited to 10 hectares or more. Two separate datasets, analysed separately — both point the same way.
|
| |
|
| |
|
Land · 10+ hectare sales
Kemps Creek: +51.2%
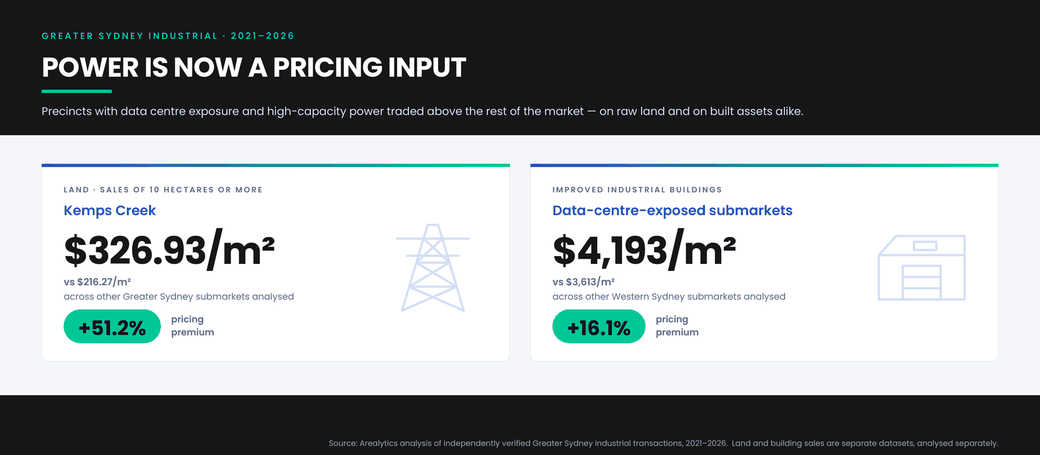
A median land rate of $326.93/m², against $216.27/m² across the other Greater Sydney submarkets analysed. Ten of the 11 highest land rates in the dataset were recorded there.
|
|
And it moved 46.0% across the period
The median Kemps Creek land rate rose from $251.82/m² to $367.68/m². These are not all data centre acquisitions — a property does not have to become a data centre to feel the effect of data centre demand.
|
|
The same pattern in built assets
Freehold industrial sales in data-centre-exposed markets ran to a median $4,193/m² against $3,613/m² elsewhere in Western Sydney — a 16.1% premium. Every exposed submarket cleared the benchmark:
| Eastern Creek |
$4,423/m² +22.4% |
| Seven Hills |
$4,254/m² +17.7% |
| Huntingwood |
$4,181/m² +15.7% |
| Erskine Park |
$3,853/m² +6.7% |
|
|
What it means for industrial value
Roads, labour, logistics networks and customer access still matter. But in Western Sydney’s fastest-growing industrial precincts, access to reliable, high-capacity electricity now sits alongside them — as a pricing input, not a servicing detail.
|
|
| |
|
Read the full analysis
The complete piece covers the land market, the built-asset premium and what the shift means for pricing across Greater Sydney.
|
|
Want the underlying transactions? Log in to Arealytics Pro.
|
|
|
Methodology: land and building transactions captured and independently verified by Arealytics across Greater Sydney, 2021–2026, and may not represent all market activity. Land analysis is limited to sales of 10 hectares or more. Building analysis covers freehold industrial sales; rates are $/m² of gross building area. 2026 figures are year to date. Land and improved building sales are separate datasets and were analysed separately.
|
|
|
Australia’s leading source of independently verified commercial property intelligence.
|
|
You’re receiving this because you subscribe to Arealytics market insights.
Unsubscribe · Update preferences
|
|
Empirical CRE Pty Ltd T/As Arealytics · ABN 99 625 506 505 · arealytics.com.au
|
|
| |
|