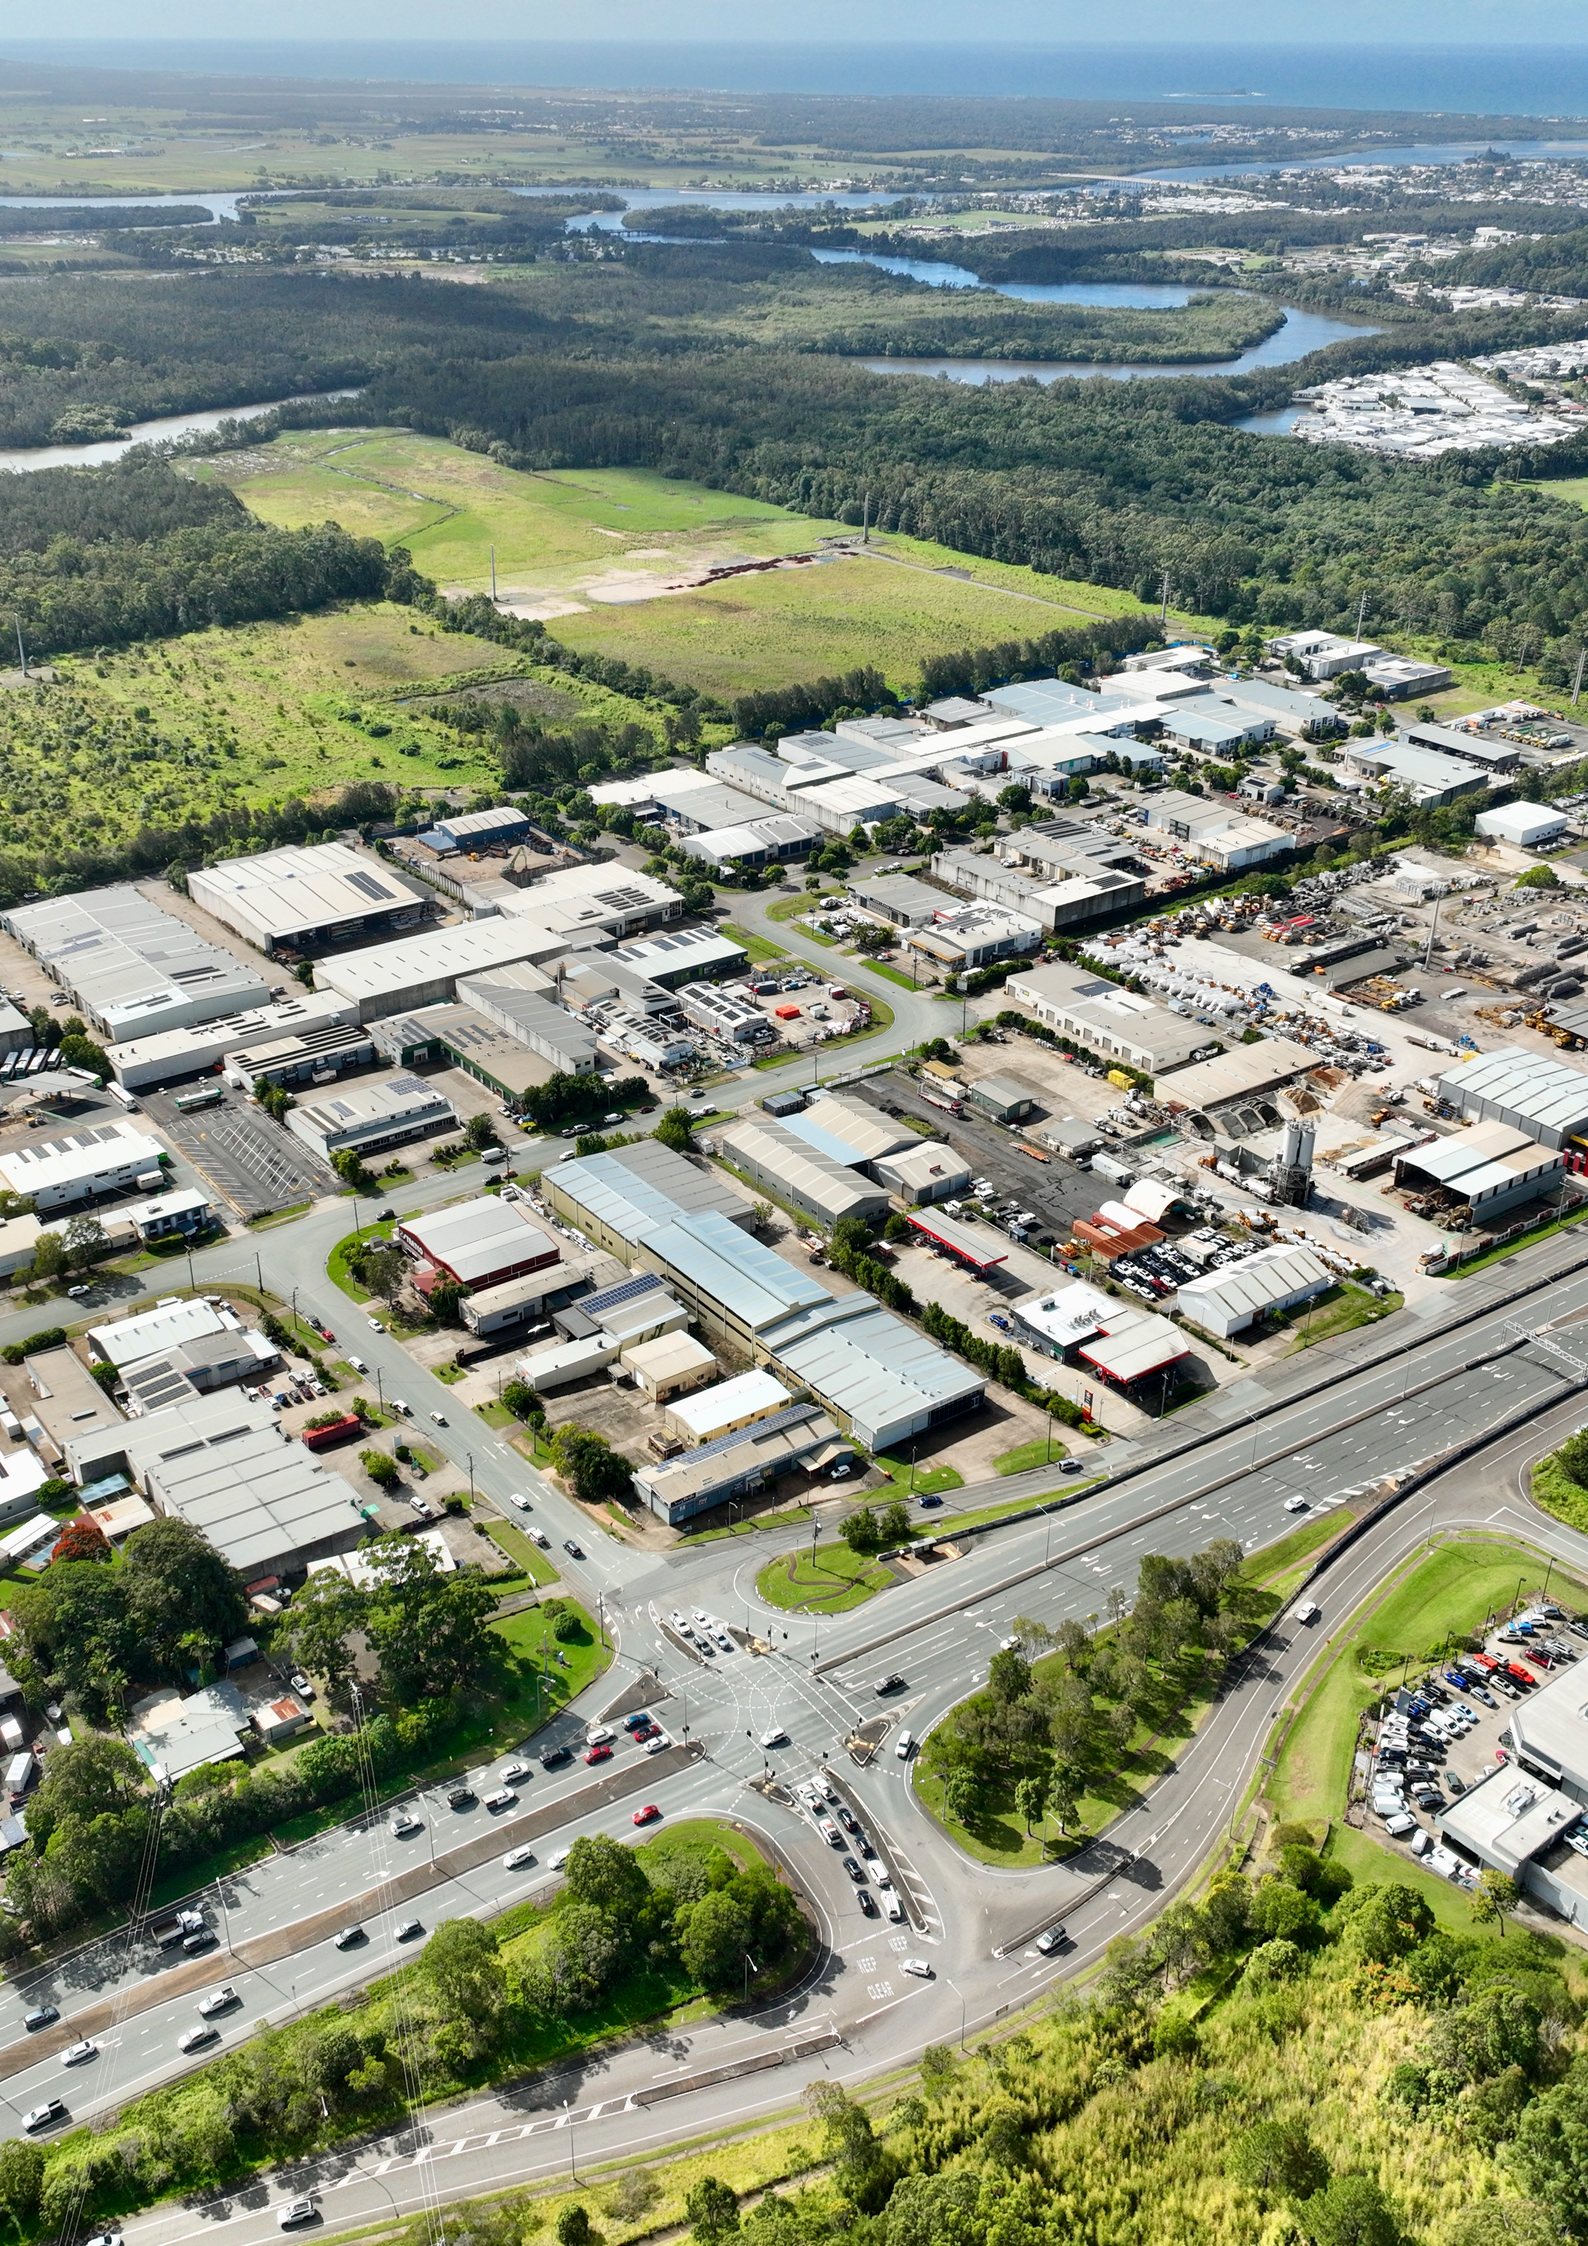
South East Queensland Office & Industrial Market Snapshot
Q2 2026 analysis of leasing activity, sales transactions and investment performance from the Sunshine Coast in the north to the southern end of the Gold Coast in the south across the office & industrial markets, with sales covering the first half of 2026.
Greater SEQ emerged as Australia’s strongest-performing major office market for median sale rate growth in H1 2026, recording a 15.8% annual increase. Investment activity was equally notable, with total sales volume exceeding Greater Sydney’s by 30.5%, despite recording fewer transactions. This divergence highlights the strength of capital deployment across Greater SEQ, reinforcing its growing significance within Australia’s commercial property investment landscape.
Sales by Structure Type
H1 2026 Office Sales Activity by Structure Type
Strata properties accounted for nearly two-thirds of all office sales in H1 2026, while freehold acquisitions attracted more than 80% of total investment, suggesting a strong appetite for larger, higher-value assets. Strata recorded the stronger year-on-year growth in median sale rates, while higher average yields across freehold transactions continue to offer investors attractive income returns.
Strata213deals
Total Sales Volume$321,397,304
Median Sale Price$735,000
Median Building Area124 m²
Median Price / m²$6,276
1 Year Price / m² Change+15.7%
Average Yield6.0%
Freehold111deals
Total Sales Volume$1,588,881,597
Median Sale Price$3,200,000
Median Building Area476 m²
Median Price / m²$6,620
1 Year Price / m² Change+10.8%
Average Yield6.6%
Economic Performance
South East Queensland Economic Backdrop, Q2 2026
3.04M*
Total Queensland employment — approximately 3.04 million employed persons in June 2026.
4.3%*
Queensland unemployment rate — Logan City recorded SEQ’s highest LGA rate, at 4.5%.
4.4%*
National unemployment rate — 10 basis points above Queensland.
Continued population growth is strengthening Greater SEQ’s consumer base and supporting broader commercial activity. With Queensland’s population growth outpacing Greater Sydney, the region is well positioned to benefit from an expanding workforce and increased business activity.
Strong interstate migration continues to contribute to Greater SEQ’s economic expansion, attracting new residents and broadening the local economic base, creating opportunities across office, retail and industrial property markets.
Tourism expenditure across Queensland reached $45.6 billion in the 12 months to June 2026, exceeding government projections by $1.4 billion, with Greater SEQ benefiting across hospitality, retail and supporting commercial services.
The $7.1 billion investment in Brisbane 2032 Olympic and Paralympic Games venue infrastructure is expected to stimulate activity across Greater SEQ, strengthening regional connectivity and supporting business expansion.
* Source: Queensland Government Statistician's Office (QGSO), Australian Bureau of Statistics (ABS)
Greater SEQ Office Lease Rate Per Square Metre Trends · Net Leases
25th Percentile
Median
75th Percentile
Office leasing conditions across Greater SEQ have shifted after a period of relatively stable rental growth, with the median commencing rate easing to $520 per m² in Q2 2026. Lower-quartile rents have remained comparatively steady, while the upper quartile has shown greater volatility.
The narrowing gap between median and upper-quartile rates points to a moderation in higher-end leasing, with tenants becoming increasingly selective and placing greater emphasis on value and occupancy costs.
Lease Structure
Most Common Lease Rate Types and Escalation in Q2 2026 Office Leases
Most Common Lease Rate Types
Percentage of Total
Fixed (59.3%)
Fixed, Market (16.3%)
Greater of % or CPI (15.1%)
CPI (8.0%)
Market (1.3%)
Shorter lease commitments are a defining feature of Greater SEQ’s office market, with 70.5% of agreements spanning three years or less. Three-year terms lead at 26.9%, closely followed by one-year leases at 24.7%. Despite this preference for shorter terms, rental escalation structures remain firmly established, with 59.3% of leases incorporating fixed annual increases. Escalations of 4.0% dominate at 34.7%, although 2.5% increases account for a notable 21.6%.
Top Escalation Rates
Percent of Total
Top Lease Terms
Percent of Total
$750/m²
Median commencing rent for A-grade office accommodation across Greater SEQ in Q2 2026.
11.3%
Lease renewals represented 11.3% of office leasing activity.
3.7%
Subleases represented 3.7% of office leasing activity.
Pricing Summary for Top Greater SEQ Office Markets · Q2 2026
Office sales activity across Greater SEQ reflected mixed market conditions, with notable variations in pricing between regions and asset types. Redland recorded the strongest annual growth in strata sale rates, rising 90.7% to $9,720/m², while Noosa led freehold growth with a 37.9% increase to $8,761/m². Brisbane remained a key market, with median strata and freehold sale rates increasing 9.8% and 13.1% respectively, while the Gold Coast recorded a 35.0% decline in freehold pricing. Across Greater SEQ, strata sale rates rose 15.4% and freehold rates 4.9% over the year.
Strata median $/m²
Freehold median $/m²
LGA
Strata
Freehold
Median m²
Median Price
Median $/m²
$/m² YoY
Median m²
Median Price
Median $/m²
$/m² YoY
Redland
61
$600,000
$9,720
+90.7%
437
$2,100,000
$6,091
+71.5%
Noosa
69
$700,000
$10,000
+51.0%
662
$5,800,000
$8,761
+37.9%
Moreton Bay
125
$750,000
$6,681
+22.0%
450
$1,528,935
$3,398
−30.6%
Logan
75
$511,000
$4,921
+13.2%
211
$1,870,089
$7,444
+39.7%
Brisbane
118
$810,000
$6,364
+9.8%
587
$4,800,000
$7,519
+13.1%
Gold Coast
94
$540,000
$5,205
+3.7%
493
$3,500,000
$5,783
−35.0%
Sunshine Coast
110
$693,127
$6,364
−0.5%
270
$2,300,000
$7,033
+81.5%
Ipswich
108
$1,100,000
$8,138
−6.5%
356
$2,000,000
$3,917
−3.1%
Scenic Rim
—
—
—
—
128
$718,000
$5,609
—
Overall
127
$750,000
$6,254
+15.4%
481
$3,300,000
$6,668
+4.9%
Office leasing by LGA — commencing rates, Q2 2026
Office leasing trends varied considerably in Q2 2026. Moreton Bay led strata rental growth, up 93.2% year on year to $516/m², followed by Noosa (+86.2%) and Brisbane (+57.9%). Freehold leasing was more moderate, with Logan recording the strongest growth at 15.2%, while Ipswich and the Gold Coast declined 17.7% and 10.1% respectively, highlighting the uneven pace of rental growth across Greater SEQ.
H1 2026 Industrial Sales Activity — State Comparison
State
Deal Count
Total Sales Volume
Median Price /m²
YoY Price /m² Change
Avg Yield
Greater SEQ
939
$2,247,608,290
$4,338
3.3%
4.8%
Greater Melbourne
1,109
$2,549,756,593
$3,344
1.4%
4.5%
Greater Perth
348
$881,260,040
$3,430
13.2%
4.5%
Greater Sydney
631
$2,296,122,797
$6,022
2.8%
4.1%
Greater Adelaide
270
$750,057,672
$3,049
−2.5%
4.8%
Industrial investment across Greater SEQ maintained solid momentum in H1 2026, with transaction volumes reflecting continued capital deployment across the sector. Median sale rates increased at more than twice the pace of Greater Melbourne, while also outperforming Greater Sydney. Despite stronger growth in Greater Perth, Greater SEQ remained one of Australia’s more active industrial investment markets, supported by substantial transaction activity and continued demand.
Sales by Structure Type
H1 2026 Industrial Sales Activity by Structure Type
Strata properties dominated industrial transaction activity in H1 2026, accounting for nearly three-quarters of all sales across Greater SEQ. Despite their smaller median property sizes, strata assets recorded a 20.2% increase in median sale rates, more than four times the growth achieved by freehold properties. Freehold assets continued to attract substantial capital, accounting for the majority of total sales value.
Strata697deals
Total Sales Volume$808,856,373
Median Sale Price$940,500
Median Building Area212 m²
Median Price / m²$4,528
1 Year Price / m² Change+20.2%
Average Yield4.7%
Freehold242deals
Total Sales Volume$1,438,751,917
Median Sale Price$3,448,500
Median Building Area913 m²
Median Price / m²$3,767
1 Year Price / m² Change+4.7%
Average Yield5.0%
Historical Activity
SEQ Industrial Sales Activity by Quarter
Freehold (volume)
Strata (volume)
Industrial investment across Greater SEQ reached $2.25 billion in the first half of 2026. Momentum strengthened in Q2, with sales climbing 29.8% on the previous quarter to $1.27 billion. Freehold properties contributed $864.6 million of Q2 sales, while strata transactions were more stable year on year. Although Q2 volumes remained below Q2 2025, the rebound highlights continued investor participation across Greater SEQ’s industrial market.
Greater SEQ Industrial Lease Rate Per Square Metre Trends
25th Percentile
Median
75th Percentile
Industrial rents across Greater SEQ have grown significantly since 2022, with upward momentum across all three pricing tiers. The median commencing rent reached $203/m² in Q2 2026, up 52.9% on Q2 2022 and 12.7% year on year.
Stronger growth at the upper end highlights demand for higher-priced accommodation, and despite some quarterly fluctuations there is little sign of a sustained market-wide correction.
Lease Structure
Most Common Lease Rate Types and Escalation in Q2 2026 Industrial Leases
Industrial leasing arrangements across Greater SEQ suggest a market where tenants are favouring flexibility while landlords seek greater certainty around future rental income. Fixed annual increases account for 42.9% of leases and the greater of a fixed increase or CPI a further 31.4%, while 4.0% escalations are the most common (39.6%). Two-, one- and three-year terms lead, at 24.6%, 22.6% and 19.3%.
Most Common Lease Rate Types
Percentage of Total
Fixed (42.9%)
Greater of % or CPI (31.4%)
CPI (16.9%)
Fixed, Market (5.4%)
Other (3.4%)
Top Escalation Rates
Percent of Total
Top Lease Terms
Percent of Total
+$95/m²
Upper-quartile commencing rents have increased by $95/m² since Q2 2022, exceeding the $70/m² increase in median rents.
2/3
Two-thirds of industrial leases were secured for three years or less, suggesting occupiers are favouring flexibility.
48.3%
of industrial leases incorporated CPI-linked rental reviews, either independently or alongside a fixed increase.
Industrial Market — Pricing by Local Government Area
LGA Pricing
Industrial Sales and Leasing by Local Government Area · H1 2026
Industrial property performance across Greater SEQ in the first half of 2026 revealed an increasingly diverse market, with strata median sale rates up 20.2% year on year against 4.7% for freehold, although freehold properties continued to attract larger investment commitments. Greater Brisbane recorded positive sales growth across both asset types while rental increases remained modest. The Gold Coast Region presented a notable contrast, with freehold sale rates climbing 39.3% despite softer leasing conditions, while the Sunshine Coast Region recorded rising freehold rents (+9.9%) alongside declining sale rates (−13.1%).
This report has been prepared by Empirical CRE Pty Ltd ("Arealytics") in partnership with Real Estate Institute of Queensland ("REIQ") for general information purposes only. It presents a snapshot of South East Queensland office and industrial market activity for the second quarter of 2026, with sales activity covering the first half of 2026.
The information contained in this report is derived from a range of sources, including publicly available records, third-party data providers and Arealytics' own research. While all reasonable care has been taken in its preparation, Arealytics makes no representation or warranty, express or implied, as to the accuracy, completeness or currency of the information, and accepts no liability for any loss or damage arising from reliance upon it.
The figures presented reflect market conditions as at the date of publication and are subject to revision as further data becomes available. Past performance is not a reliable indicator of future performance.
Nothing in this report constitutes financial, investment, taxation or legal advice, and it should not be relied upon as such. Recipients should obtain independent professional advice before making any decision based on its contents.
The contents of this report remain the intellectual property of Arealytics and intended solely for the named recipient which has requested a copy. It may not be reproduced, distributed or referenced, in whole or in part, without reference to Arealytics.
Prepared By
Misty Belsha
Market Insights & Research Lead misty.belsha@arealytics.com.au