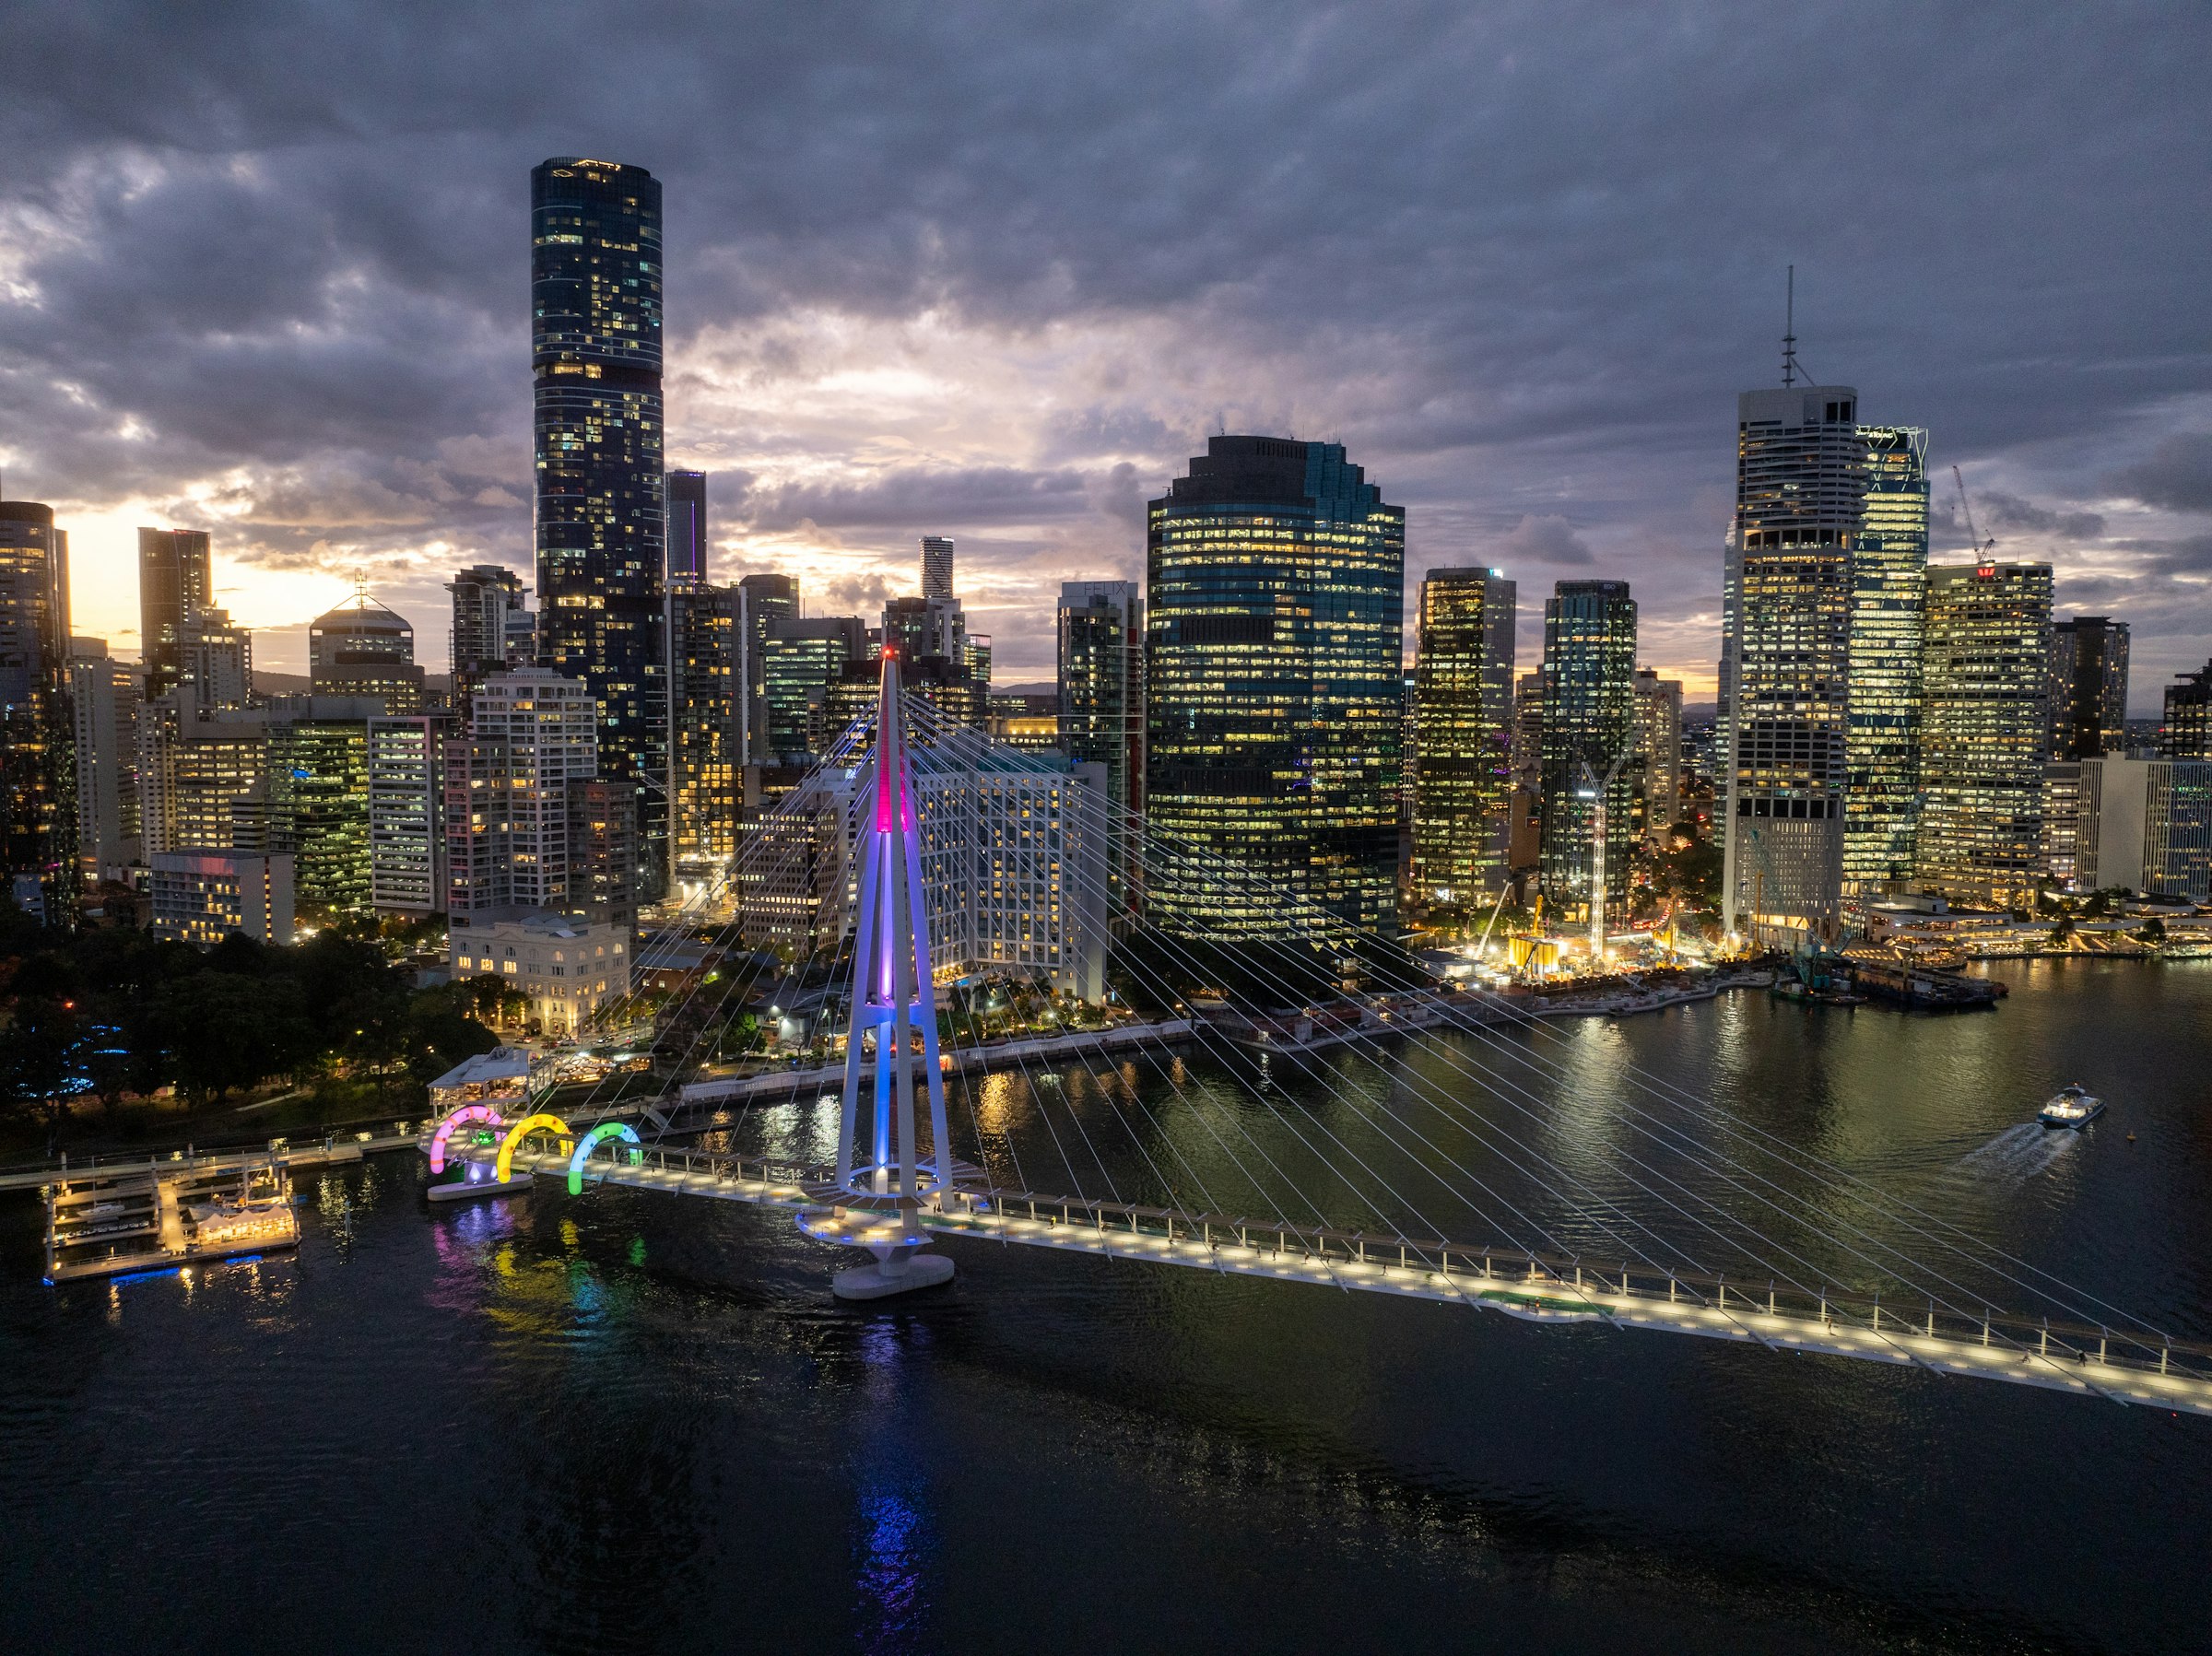
South East Queensland Office & Industrial Market Snapshot
Q1 2026 analysis of leasing activity, sales transactions and investment performance from the Sunshine Coast in the north to the southern end of the Gold Coast in the south across the office & industrial markets.
Strata assets continued to account for the majority of office sales across South East Queensland in 2026, making up nearly 70.0% of all transactions. Despite fewer sales, freehold properties generated more than 80.0% of total sales volume, reflecting investor demand for larger, higher-value assets. Median sale prices increased 4.09% year over year, while freehold properties recorded a higher average yield (7.6%) than strata assets (6.29%), highlighting the different characteristics of each investment type.
Sales by Structure Type
Q1 2026 Office Sales Activity by Structure Type
Strata offices accounted for roughly two thirds of all office transactions in Q1 2026, reflecting continued demand for smaller investment opportunities. Despite fewer sales, freehold assets generated more than $557 million in sales turnover and recorded the higher average yield of 7.6%.
Strata101deals
Total Sales Volume$91,417,408
Median Sale Price$750,000
Median Building Area130 m²
Median Price / m²$5,905
1 Year Price / m² Change-0.7%
Average Yield6.29%
Freehold48deals
Total Sales Volume$557,937,485
Median Sale Price$2,750,000
Median Building Area486 m²
Median Price / m²$6,063
1 Year Price / m² Change+5.3%
Average Yield7.60%
Economic Performance
South East Queensland Economic Backdrop, Q1 2026
3.01M*
Total Southeast Queensland employment — annual growth of 37,600 jobs.
4.10%*
SEQ unemployment rate — a growing labour force contributed to a slight increase.
4.20%*
National unemployment rate — 10 basis points above SEQ.
Higher workforce participation contributed to a modest increase in unemployment as more people entered the labour market in search of employment, outpacing short-term job creation.
International tourism continued to strengthen, with 2.4 million visitors contributing a record $8.2 billion to Queensland's economy in the year to March 2026.
South East Queensland's economic momentum is expected to continue, with GSP forecast to grow by 2.5% in 2025–26 after leading all states with 2.2% growth in 2024–25.
Major infrastructure projects, including Brisbane 2032 Olympic preparations and transport upgrades, continued to support construction activity, employment and business confidence.
* Source: Queensland Government Statistician's Office (QGSO)
Average commencing rents reached $650 per sqm in Q1 2026, representing a 21.3% increase over the past year.
This highlights the differing roles each asset type plays within the market, with strata providing greater transaction activity and freehold assets offering larger-scale investment opportunities.
Lease Structure
Most Common Lease Rate Types and Escalation in Q1 2026 Office Leases
Most Common Lease Rate Types
Percentage of Total
Fixed (56.9%)
Fixed, Market (26.8%)
CPI (9.1%)
Greater of % of CPI (6.5%)
Market, CPI (0.6%)
The market continued to favour fixed rental review mechanisms over CPI-linked structures, providing greater certainty for both landlords and tenants. Fixed annual increases were most commonly negotiated at rates between 3.0% and 4.0%, reinforcing the prevalence of stable, predetermined rental growth provisions.
Pricing Summary for Top QLD Office Suburbs by Transaction Count
Office market performance varied across South East Queensland during Q1 2026, with established commercial precincts continuing to attract the strongest leasing demand and premium rental outcomes. While Brisbane City remained the most active leasing market, suburbs including Fortitude Valley and Newstead continued to command higher commencing rents, reflecting sustained occupier demand for well-located, higher-quality office accommodation. Investment activity also remained diverse across the region, with sale rates varying significantly between suburbs and asset types, reinforcing the importance of location, building quality and investment profile in pricing outcomes.
Q1 2026 Industrial Sales Activity — State Comparison
State
Deal Count
Total Sales Volume
Median Price /m²
YoY Price /m² Change
Avg Yield
Greater SEQ
435
$924,487,913
$4,348
3.7%
5.8%
Greater Melbourne
538
$1,252,421,470
$3,431
3.9%
4.8%
Greater Adelaide
118
$401,399,121
$3,132
1.1%
5.9%
Greater Perth
169
$363,574,371
$3,429
12.9%
5.2%
Greater Sydney
269
$920,400,001
$6,026
2.8%
6.6%
South East Queensland recorded the second-highest industrial sales volume nationally, with $924.5 million in transactions during Q1 2026. Median industrial sales in SEQ increased 3.7% year-over-year, reflecting continued strength in industrial asset values across the region. Australia's five largest industrial markets recorded a combined 1,529 industrial property transactions during Q1 2026, demonstrating continued depth and liquidity across the industrial investment sector.
Sales by Structure Type
Q1 2026 Industrial Sales Activity by Structure Type
The Queensland industrial investment market recorded a strong first quarter of 2026, with strata assets accounting for more than 77% of all sales. Despite fewer transactions, freehold properties generated the highest sales turnover, reaching $547.7 million, reflecting continued demand for larger industrial assets. Average yields remained closely aligned across both asset types, at 5.6% for freehold properties and 5.8% for strata assets. Over the 12 months to Q1 2026, median sale rates increased across both market segments, with freehold properties recording annual growth of 18.1%, while strata assets increased by 8.1%.
Strata336deals
Total Sales Volume$376,818,870
Median Sale Price$900,000
Median Building Area200 m²
Median Price / m²$4,599
1 Year Price / m² Change+28.7%
Average Yield5.80%
Freehold99deals
Total Sales Volume$547,669,043
Median Sale Price$3,500,000
Median Building Area990 m²
Median Price / m²$3,571
1 Year Price / m² Change+3.6%
Average Yield5.60%
Historical Activity
SEQ Industrial Sales Activity by Quarter
Strata (volume)
Freehold (volume)
Deal count
Queensland's industrial sector maintained positive momentum during Q1 2026 as strong economic conditions continued to support both occupier and investor demand. Strata assets remained the preferred entry point for many investors, while freehold properties offered significantly larger building sizes and continued to underpin the market's higher-value transactions. This balance between accessibility and scale contributed to a diverse and active investment market.
Premium industrial assets continued to command higher commencing rents, with upper-quartile rates reaching $241 per square metre, up 3.3% year over year.
Median commencing rents softened during the quarter as leasing activity expanded beyond premium industrial assets into more affordable properties.
Lease Structure
Most Common Lease Rate Types and Escalation in Q1 2026 Industrial Leases
Queensland industrial leases were most commonly structured around fixed rental reviews, providing landlords and tenants with greater certainty around future rent movements. Annual increases of 4.0% remained the benchmark escalation rate, reinforcing expectations for consistent income growth across the market.
Most Common Lease Rate Types
Percentage of Total
Fixed (49.6%)
Greater of % or CPI (29.1%)
CPI (13.4%)
Fixed, Market (5.5%)
Market, CPI (2.4%)
Top Escalation Rates
Percent of Total
Top Lease Terms
Percent of Total
66%
Nearly two-thirds of leases with a fixed annual increase adopted escalation rates between 3% and 4%.
22.3%
Three-year lease terms were the most common commitment, accounting for 22.3% of all industrial leases.
≈60%
Freehold transactions represented less than one-quarter of all sales but accounted for almost 60% of total sales volume.
Pricing Summary for Top 10 SEQ Suburbs by Transaction Count
The SEQ industrial market continued to perform strongly across a range of established precincts during Q1 2026. Burleigh Heads remained the region's busiest leasing market, Southport recorded the highest upper-quartile commencing lease rate, and Coolum Beach led all suburbs for sales activity, highlighting the depth of the region's industrial market.
This report has been prepared by Empirical CRE Pty Ltd ("Arealytics") in partnership with Real Estate Institute of Queensland ("REIQ") for general information purposes only. It presents a snapshot of South East Queensland office and industrial market activity for the first quarter of 2026.
The information contained in this report is derived from a range of sources, including publicly available records, third-party data providers and Arealytics' own research. While all reasonable care has been taken in its preparation, Arealytics makes no representation or warranty, express or implied, as to the accuracy, completeness or currency of the information, and accepts no liability for any loss or damage arising from reliance upon it.
The figures presented reflect market conditions as at the date of publication and are subject to revision as further data becomes available. Past performance is not a reliable indicator of future performance.
Nothing in this report constitutes financial, investment, taxation or legal advice, and it should not be relied upon as such. Recipients should obtain independent professional advice before making any decision based on its contents.
The contents of this report remain the intellectual property of Arealytics and intended solely for the named recipient which has requested a copy. It may not be reproduced, distributed or referenced, in whole or in part, without reference to Arealytics.
Prepared By
Misty Belsha
Market Insights & Research Lead misty.belsha@arealytics.com.au