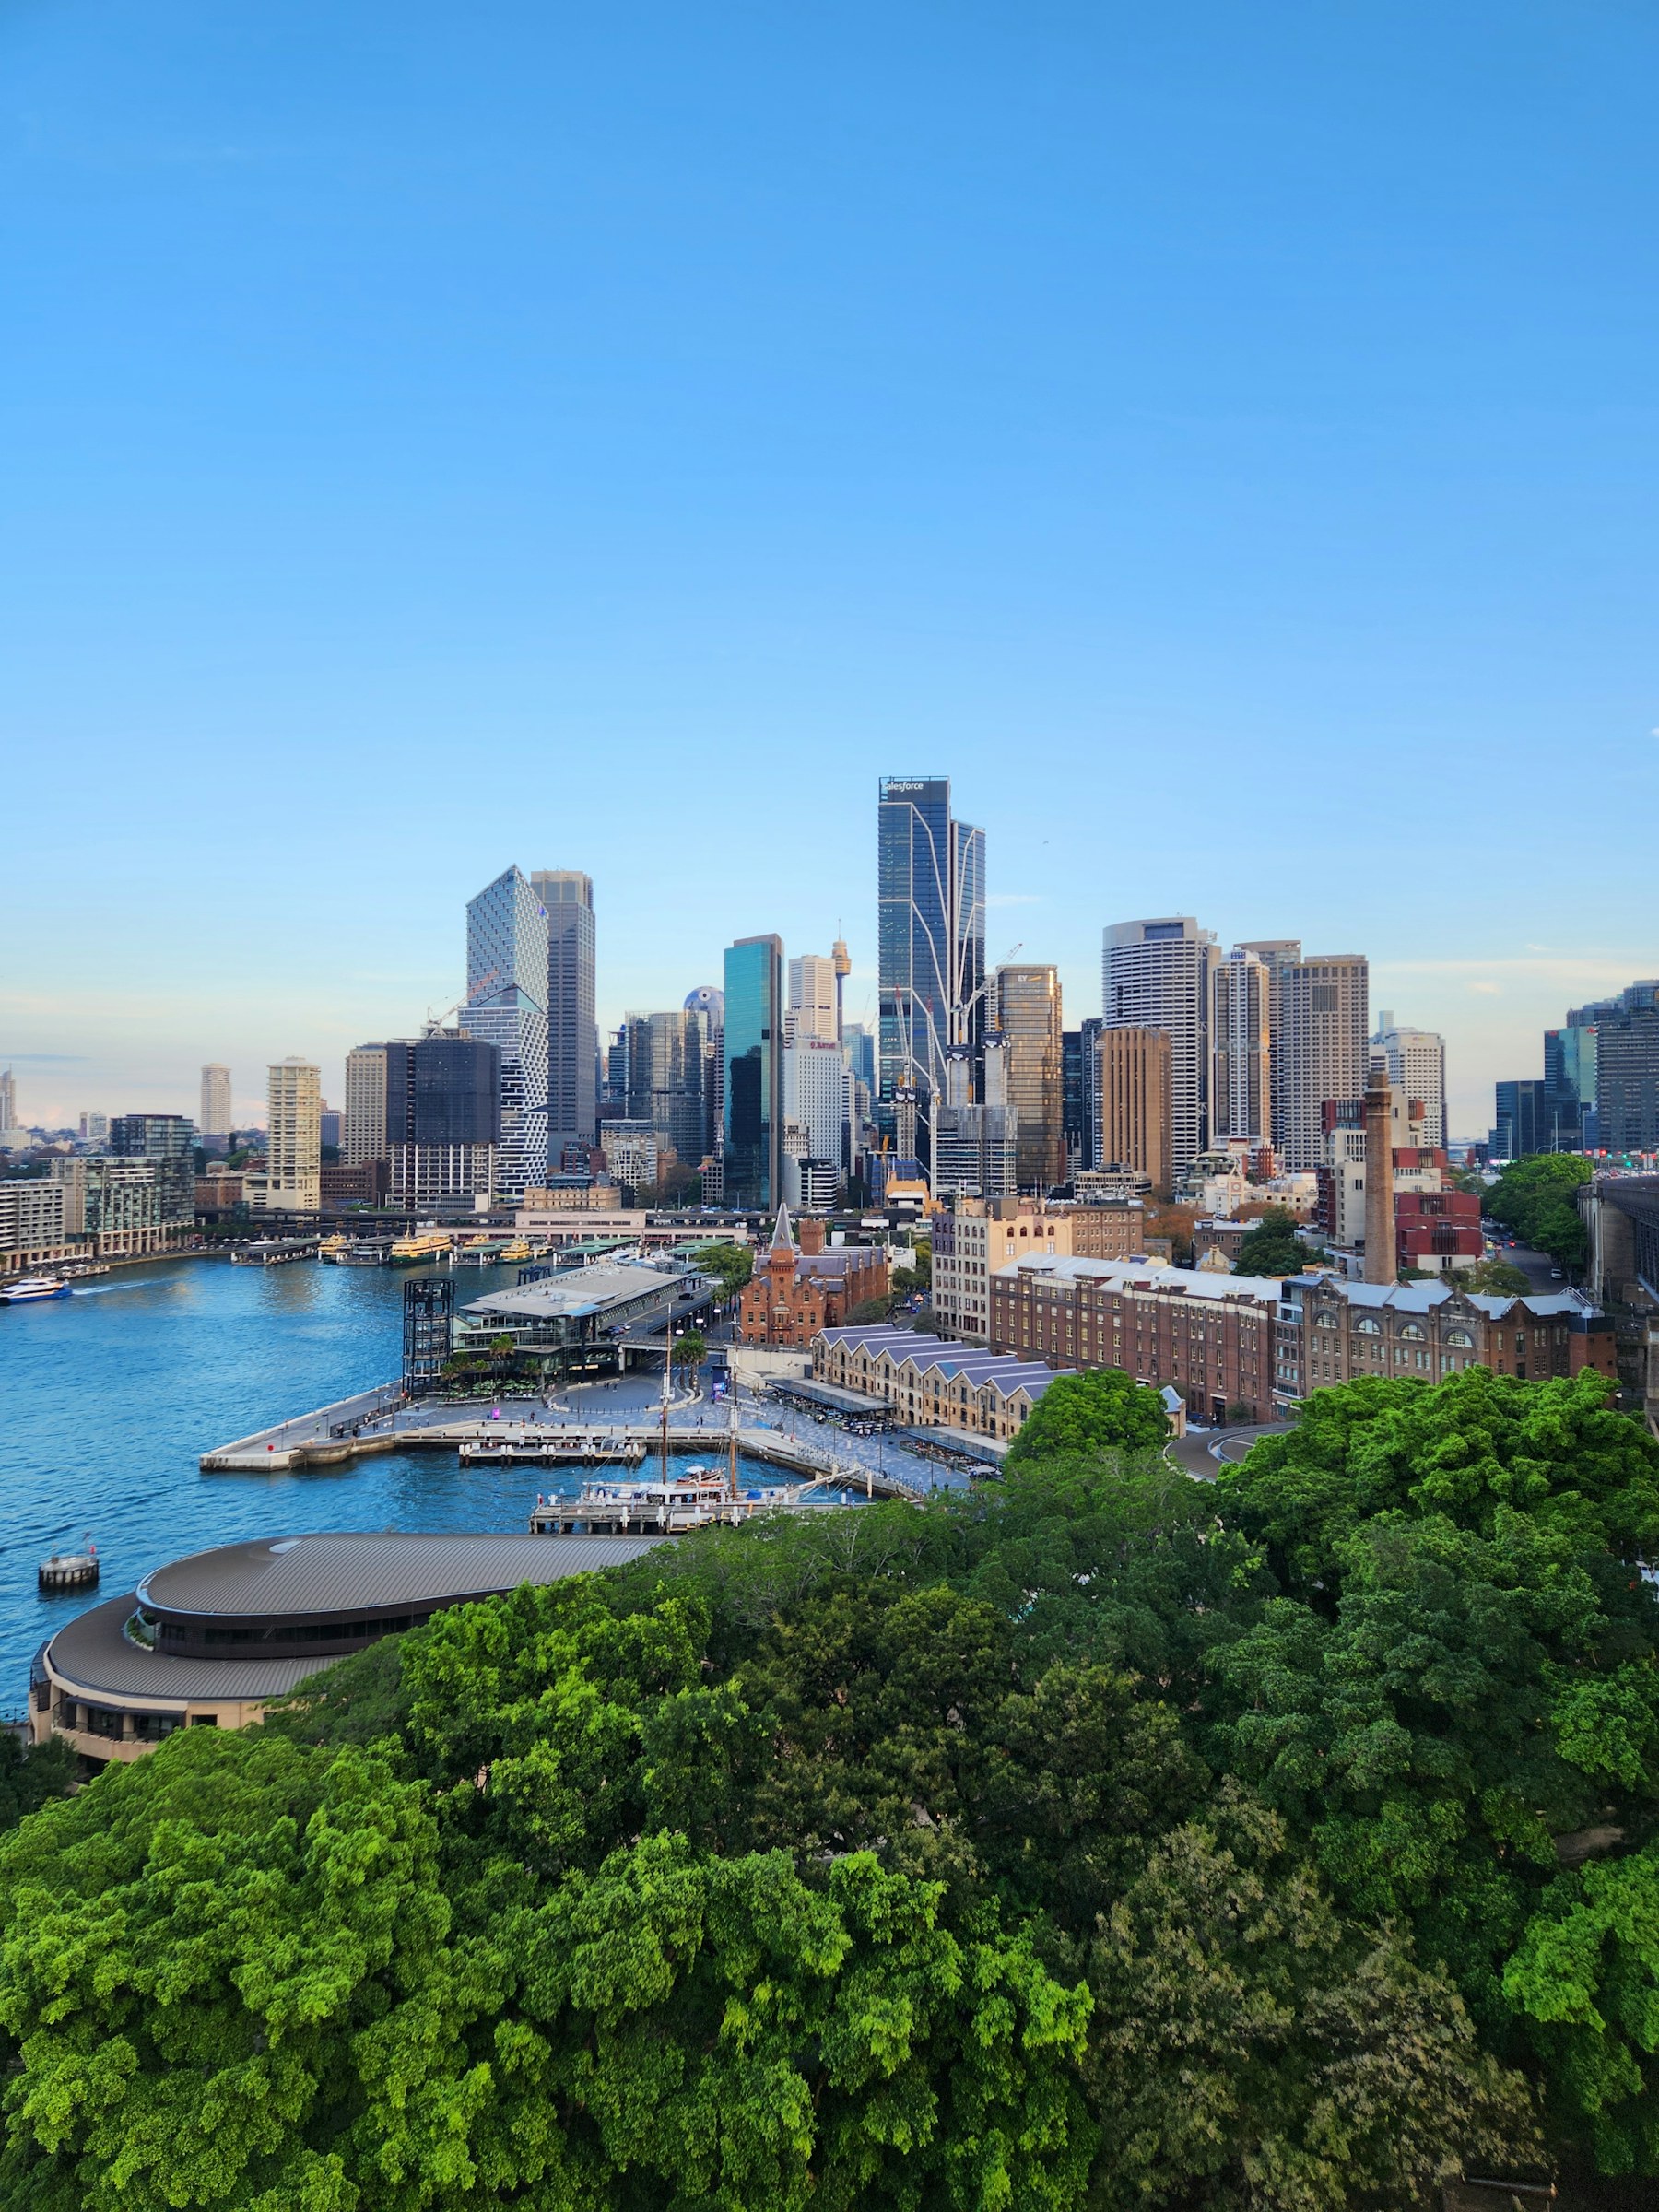
Sydney's office market continued to outperform Australia's other major office markets, recording nearly double the total sales volume while also achieving median sale rates per square metre almost twice those of the other capital cities. This reflects the market's concentration of high-value office assets and continued investor demand for premium stock.
Sales by Structure Type
Q1 2026 Office Sales Activity by Structure Type
Strata transactions represented more than 85% of office sales across Greater Sydney in 2026, while freehold assets made up the remaining 14.5%. Despite the difference in transaction volume, median sale rates were broadly consistent across both ownership structures.
Strata130deals
Total Sales Volume$139,034,413
Median Sale Price$797,500
Median Building Area97 m²
Median Price / m²$9,091
1 Year Price / m² Change+5.5%
Freehold22deals
Total Sales Volume$900,661,299
Median Sale Price$3,000,000
Median Building Area492 m²
Median Price / m²$8,686
1 Year Price / m² Change+5.4%
Economic Performance
Greater Sydney Economic Backdrop, Q1 2026
4.53M*
Total Greater Sydney employment — increased 0.7% year-over-year, adding 30,800 jobs.
4.3%*
Greater Sydney unemployment rate — up 20 basis points over the 12 months to March 2026.
4.2%*
National unemployment rate — Greater Sydney sits 10 basis points above the national average.
Population across Greater Sydney is projected to grow by almost two million people over the next 20 years.
Greater Sydney is Australia's largest state economy, generating around one-third of the nation's economic output.
With a workforce of 4.53 million employed people, Greater Sydney remains Australia's largest employment market.
Service industries account for 90.0% of employment across Greater Sydney.
Greater Sydney Settled Transactions & Lease Report · Q1 2026
Office Market — Lease Activity & Rate Trends
Lease Rate Trends
Greater Sydney Office Lease Rate Per Square Metre Trends
25th Percentile
Median
75th Percentile
Median commencing office rents reached $850 per square metre in Q1 2026, declining 7.6% over the year.
The gap between lower and upper-quartile asking rents narrowed over the year, suggesting the moderation in office rents was more pronounced across premium accommodation than the broader market.
Lease Structure
Most Common Lease Rate Types and Escalation in Q1 2026 Office Leases
Most Common Lease Rate Types
Percentage of Total
Fixed (69.7%)
Fixed, Market (20.9%)
The greater of % or CPI (7.1%)
CPI (1.3%)
Market, CPI (1.0%)
Five-year lease terms continued to dominate leasing activity across the NSW office market during Q1 2026, accounting for 33.8% of all agreements executed. Three-year commitments followed at 24.0%, highlighting occupiers' preference for medium-term lease structures that balance long-term certainty with operational flexibility. This trend reflects continued confidence in the office market while allowing businesses to remain adaptable to changing workplace requirements.
Top Escalation Rates
Percent of Total
Top Lease Terms
Percent of Total
$1,750/m²
Class A office assets in Sydney's CBD averaged $1,250 per square metre, while the market's premium office space commanded up to $1,750 per square metre.
7.6%
Subleases accounted for just 7.6% of office leases signed.
11.9%
Renewals remained a modest share of the market, accounting for 11.9% of office leases signed.
Greater Sydney Settled Transactions & Lease Report · Q1 2026
Office Market — Suburb Pricing Summary
Suburb Pricing
Pricing Summary for Top Greater Sydney Office Suburbs by Transaction Count
Leasing activity remained concentrated in the suburb of Sydney during Q1 2026, recording 122 lease transactions while continuing to command some of the state's highest median commencing rents at $1,200 per square metre. North Sydney followed with 39 lease transactions, reinforcing its position as one of Greater Sydney's key office precincts. Among the State's 10 most active leasing suburbs, Norwest recorded the lowest median commencing rent at $324 per square metre, providing a more affordable option for occupiers. Investment activity remained weighted towards strata assets, reflecting continued demand for smaller office investment opportunities across Greater Sydney.
Q1 2026 Industrial Sales Activity — State Comparison
State
Deal Count
Total Sales Volume
Median Price /m²
YoY Price /m² Change
Avg Yield
Greater Sydney
270
$932,934,701
$6,050
4.1%
4.0%
Greater SEQ
434
$931,467,113
$4,318
8.0%
4.6%
Greater Melbourne
536
$1,248,102,082
$3,439
0.9%
4.3%
Greater Adelaide
120
$409,399,121
$3,230
0.1%
5.2%
Greater Perth
176
$384,878,369
$3,433
24.3%
4.5%
Greater Sydney reinforced its position as Australia's premier industrial investment market in 2026, recording the highest median sale rates per square metre by a considerable margin despite total sales volume remaining broadly in line with Greater SEQ.
Sales by Structure Type
Q1 2026 Industrial Sales Activity by Structure Type
Investment activity remained heavily weighted towards strata assets, accounting for more than four in every five industrial transactions completed during Q1 2026. Despite this, freehold properties generated the majority of total sales volume through fewer, higher-value transactions. Strata assets, however, continued to command higher sale rates per square metre, reflecting strong demand for smaller industrial investments.
Strata225deals
Total Sales Volume$282,541,900
Median Sale Price$1,105,500
Median Building Area181 m²
Median Price / m²$6,271
1 Year Price / m² Change+6.1%
Average Yield3.9%
Freehold45deals
Total Sales Volume$650,392,801
Median Sale Price$4,250,000
Median Building Area771 m²
Median Price / m²$5,459
1 Year Price / m² Change-8.0%
Average Yield4.4%
Historical Activity
Greater Sydney Industrial Sales Activity by Quarter
Strata (volume)
Freehold (volume)
Deal count
Market liquidity improved considerably during Q1 2026, with industrial transactions increasing almost 70% compared with the same period last year. The uplift in deal activity was accompanied by a modest decline in sales turnover, indicating that capital deployment was concentrated across a larger number of smaller transactions rather than major freehold acquisitions. Continued demand for strata assets reinforced this trend, highlighting sustained investor appetite for more accessible industrial investments.
Greater Sydney Settled Transactions & Lease Report · Q1 2026
Industrial Market — Lease Activity & Rate Trends
Lease Rate Trends
Greater Sydney Industrial Lease Rate Per Square Metre Trends
25th Percentile
Median
75th Percentile
Rental growth remained well distributed across the Greater Sydney industrial market during Q1 2026, indicating that leasing demand continued to support values across both more affordable and premium industrial space.
Growth has moderated from the rapid increases of recent years, but market fundamentals remain supportive of further rental appreciation.
Lease Structure
Most Common Lease Rate Types and Escalation in Q1 2026 Industrial Leases
Fixed rental escalations remained the preferred review mechanism across Greater Sydney's industrial market, accounting for 64.5% of lease agreements. A further 23.3% of leases adopted a "the greater of % or CPI" structure, providing landlords with protection against inflation while ensuring a minimum rental increase. CPI-linked reviews were comparatively uncommon, representing just 1.5% of leases either on a standalone basis or in combination with market reviews.
Most Common Lease Rate Types
Percentage of Total
Fixed (64.5%)
The greater of % or CPI (23.3%)
Fixed, Market (8.1%)
Market, CPI (2.6%)
CPI (1.5%)
Top Escalation Rates
Percent of Total
Top Lease Terms
Percent of Total
≈60%
Nearly 60.0% of industrial leases were executed on terms of five years or less.
$315/m²
Upper-quartile commencing rents climbed to $315 per square metre.
87%+
More than 87.0% of leases incorporated either fixed annual increases or a "the greater of" review provision.
Greater Sydney Settled Transactions & Lease Report · Q1 2026
Industrial Market — Suburb Pricing Summary
Structure-Type Pricing Trend
Average Price per m² by Structure Type
Industrial · quarterly · Q1 2023 — Q1 2026
Freehold
Strata
Suburb Pricing
Pricing Summary for Top 10 Greater Sydney Industrial Suburbs by Transaction Count
The distribution of leasing activity continued to favour Greater Sydney's established industrial precincts, with Wetherill Park leading the market for lease transactions while maintaining comparatively affordable asking rents. By comparison, Alexandria achieved the highest median asking rent among the leading industrial suburbs, reinforcing the premium occupiers continue to place on scarce inner-city industrial accommodation. Sales activity was largely driven by strata assets, although freehold transactions remained concentrated in a small number of suburbs where median sale rates consistently exceeded $6,000 per square metre.
To ensure maximum accuracy and coverage, sale and lease transaction data in this Settled Transactions Report incorporates official public and statutory records across Australian jurisdictions as well as other data sources from other direct market participants and data partnerships. Due to standard settlement periods and reporting processing windows, official transactional data is subject to a minimum one-quarter lag. Consequently, First Quarter (Q1 ending 31 March) figures reflect verified, reconciled data available for publication in July. This structured timeline ensures preliminary or unverified transactions do not distort market trends, providing stakeholders with a complete and reliable analysis.
Important Notice
Disclaimer & Terms of Use
This report has been prepared by Empirical CRE Pty Ltd ("Arealytics") in partnership with Real Estate Institute of New South Wales ("REINSW") for general information purposes only. It presents a snapshot of Greater Sydney office and industrial market activity for the first quarter of 2026.
The information contained in this report is derived from a range of sources, including publicly available records, third-party data providers and Arealytics' own research. While all reasonable care has been taken in its preparation, Arealytics makes no representation or warranty, express or implied, as to the accuracy, completeness or currency of the information, and accepts no liability for any loss or damage arising from reliance upon it.
The figures presented reflect market conditions as at the date of publication and are subject to revision as further data becomes available. Past performance is not a reliable indicator of future performance.
Nothing in this report constitutes financial, investment, taxation or legal advice, and it should not be relied upon as such. Recipients should obtain independent professional advice before making any decision based on its contents.
The contents of this report remain the intellectual property of Arealytics and intended solely for the named recipient which has requested a copy. It may not be reproduced, distributed or referenced, in whole or in part, without reference to Arealytics.
Prepared By
Misty Belsha
Market Insights & Research Lead misty.belsha@arealytics.com.au