- Green never carries text on white (2.16:1), so every premium figure sits in a green pill with near-black type — which also makes it the loudest thing on each image. That is the right call: the premium is the story.
- Land and building sales are separate datasets. They are never combined into one chart, and the source line on image 1 says so.
- Rebuild any time with
python3 tools/build_power_value_images.py— the figures live in one block at the top of that file.
Image 1
Power is now a pricing input
Replaces the supplied two-panel example. Goes where the draft says “Example: Data on the last page” under Start with Land — or at the top as the hero, since it carries both headline numbers.
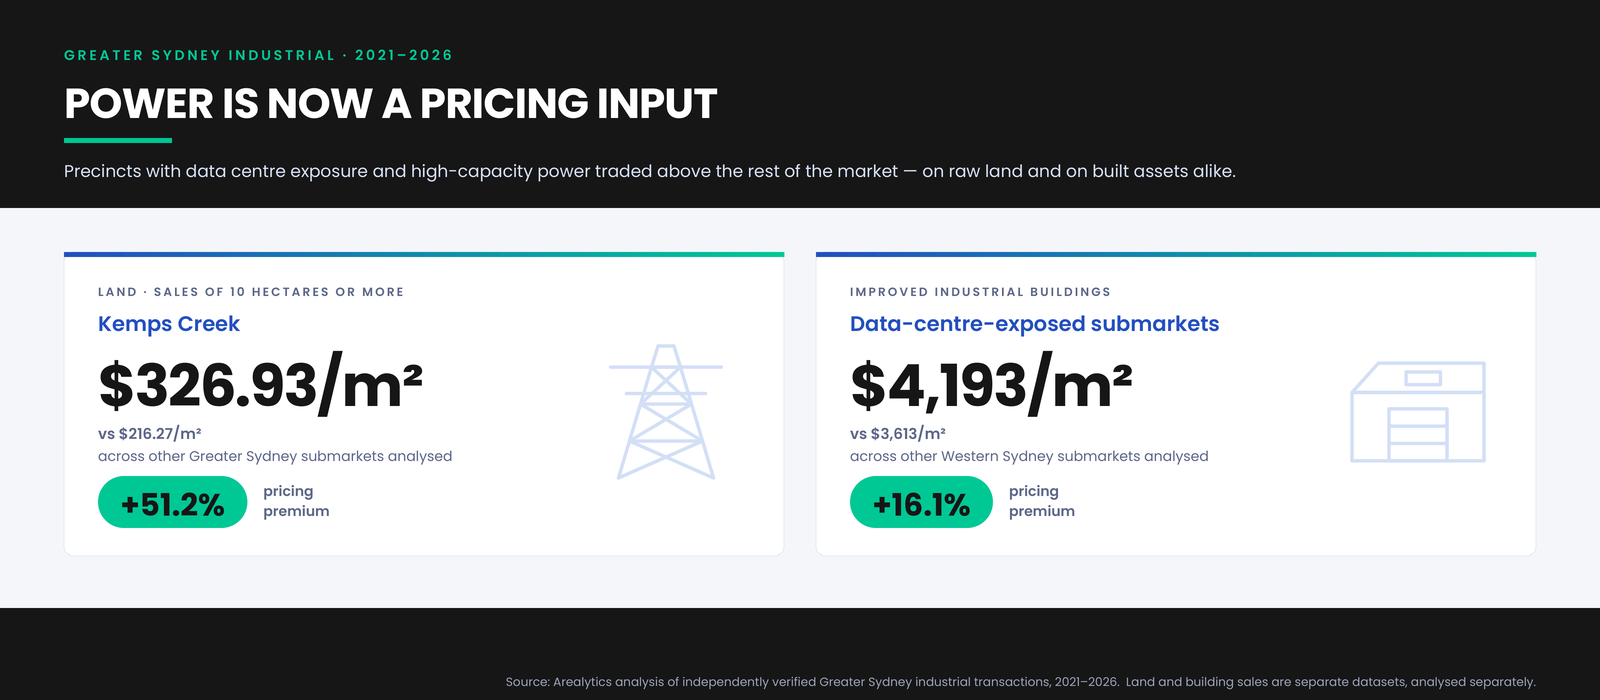
Image 2
Kemps Creek led the land market
New — there was no example for this. It illustrates the “The land pricing trend is just as telling” paragraph, which is the only place in the draft with real figures and no image: the gap against the rest of Greater Sydney, and the $251.82 → $367.68 movement.
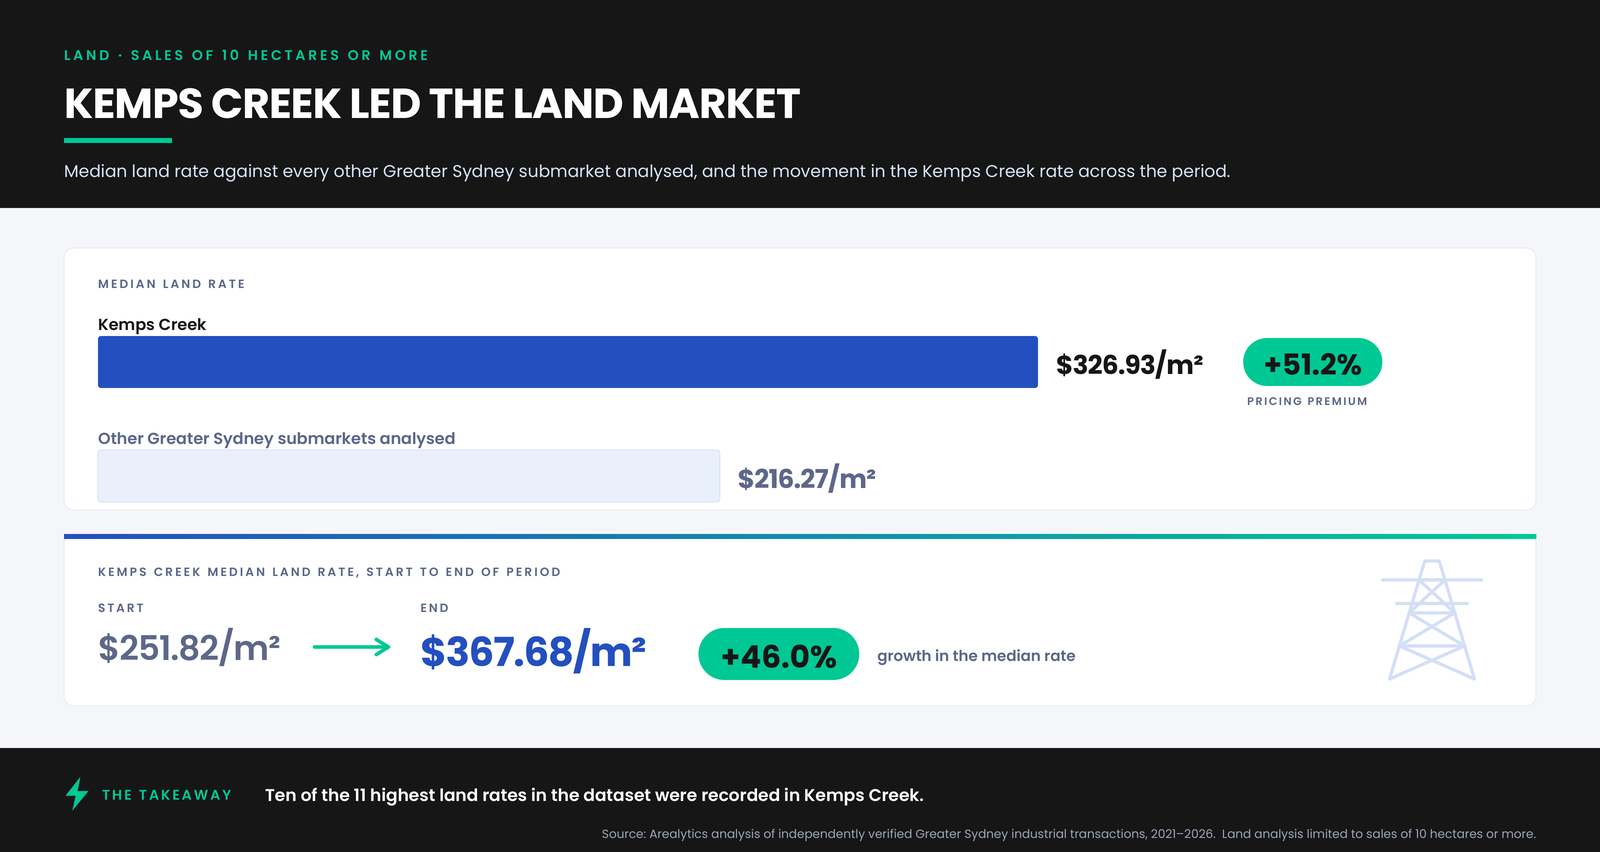
Image 3
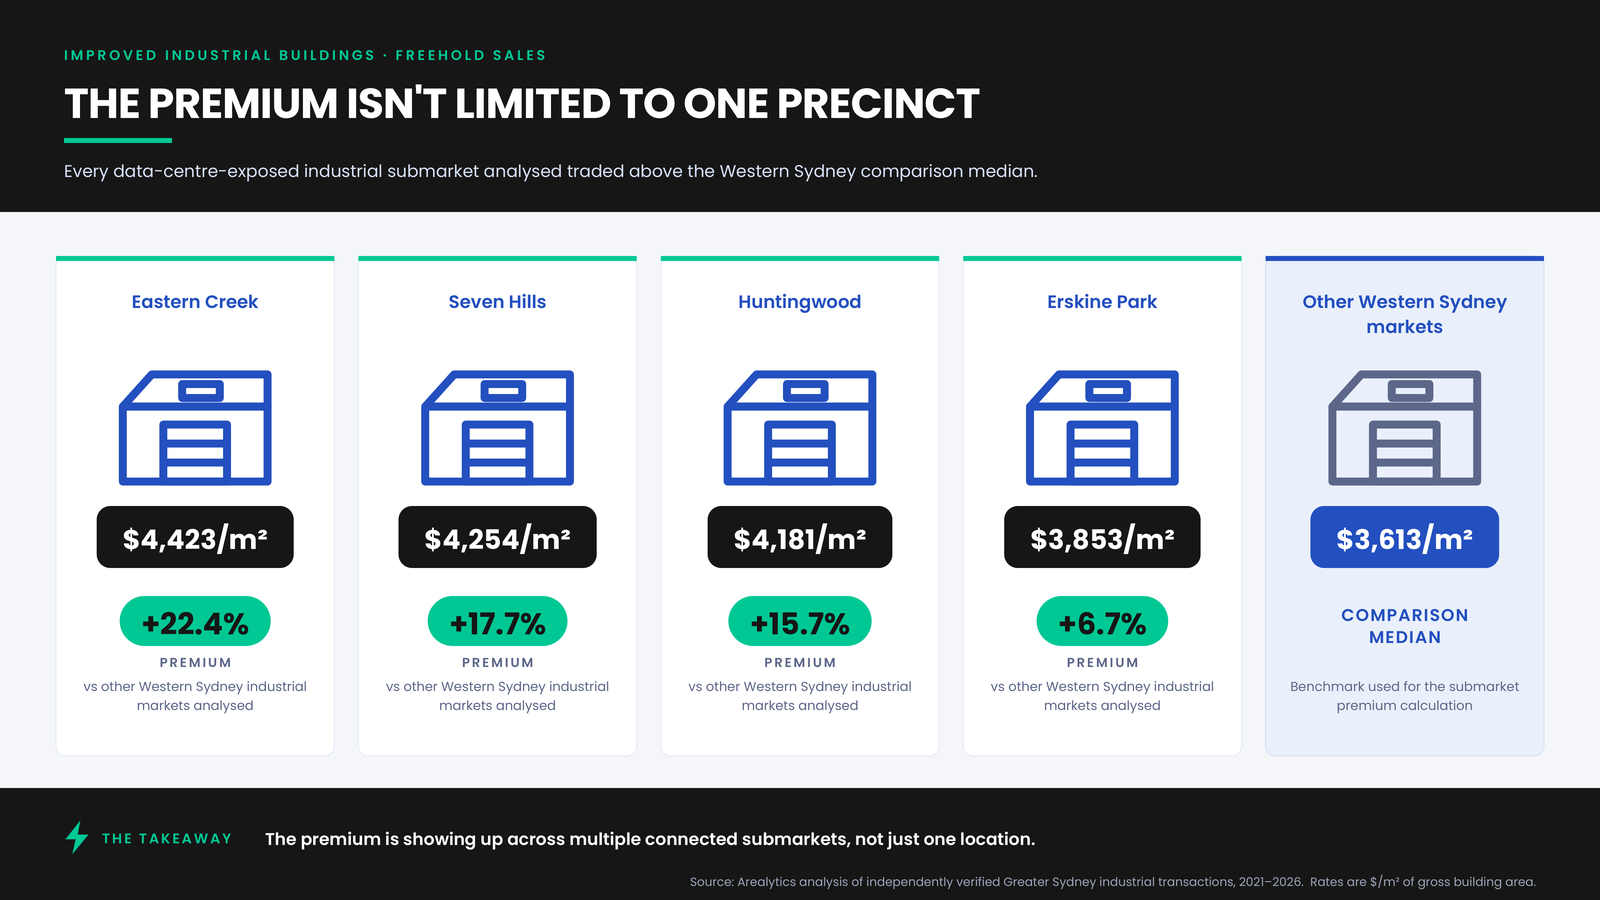
The premium isn’t limited to one precinct
Replaces the supplied five-column example. Goes where the draft says “Example: Data on the last page” under The Same Pattern in Built Assets.