What to check
Figures match the tile · the wording reads well for our market · nothing overstates what the data shows · the caption works on its own. One to look at closely: the retail price-and-yield article repeats Adelaide's 2.4% strata yield from the 6 October tile. And the Melbourne industrial article says “about 24%” and “about 4%”: the August tile shows +24.1% and +4.3%, but the rent series in the same brief works out to +24.0% and +4.1%.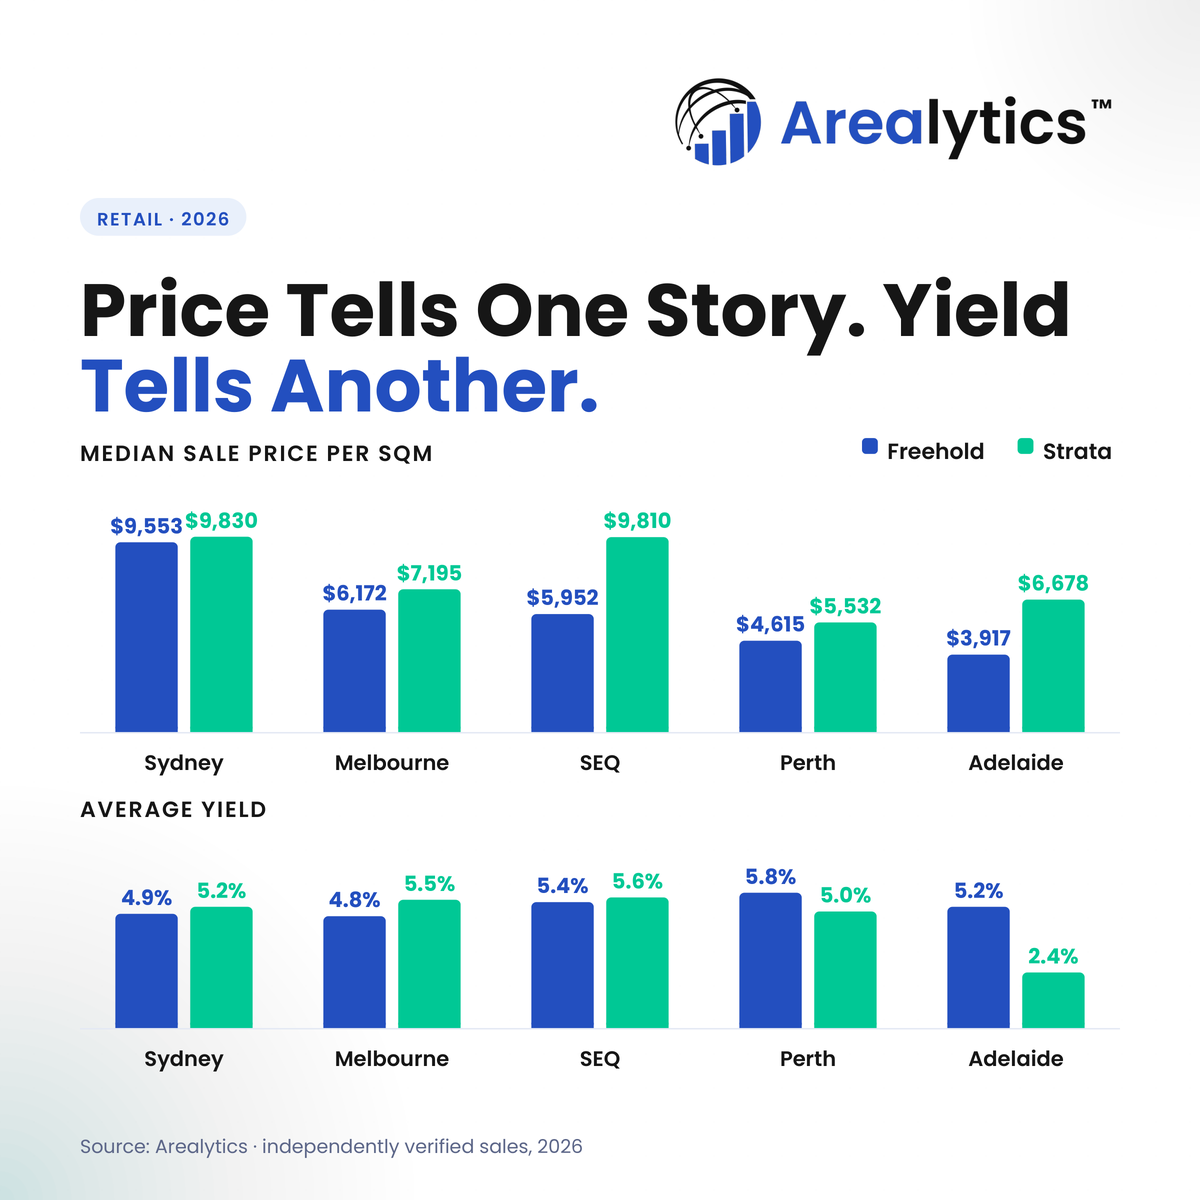
Price tells one story, yield tells another: retail across Australia’s five largest markets
Arealytics compared 2026 retail sale prices and yields across five markets. Strata sold for more per m² than freehold in every one, but yields told a different story.
This post has already run. Once the article is live, add its link as a comment on the 6 October post.
Read the full analysis: https://www.arealytics.com.au/insight-retail-price-yield-five-markets-oct-2026
Will publish at https://www.arealytics.com.au/insight-retail-price-yield-five-markets-oct-2026
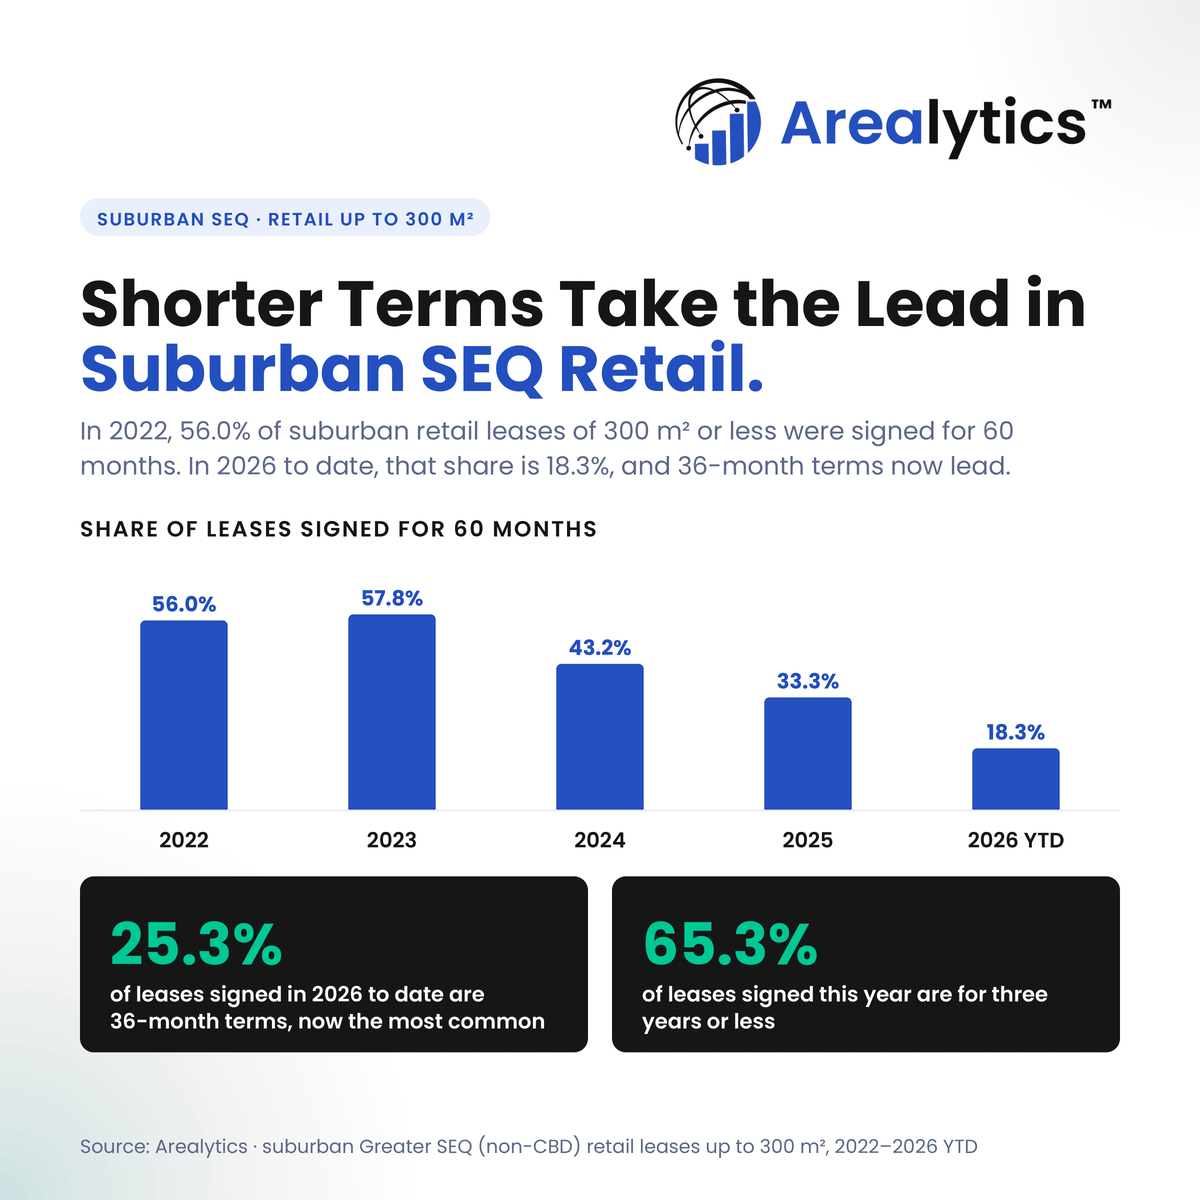
Shorter terms take the lead in suburban SEQ retail
In 2022, 56.0% of suburban SEQ retail leases of 300 m² or less ran for five years. In 2026 to date it is 18.3%, and 36-month terms now lead.
Five-year leases no longer dominate smaller-format retail in suburban SEQ.

In 2022, 56.0% of retail leases of 300 m² or less across suburban Greater SEQ were signed for 60 months. In 2026 to date, it's 18.3% — and 36-month terms now lead at 25.3%.

65.3% of leases signed this year run for three years or less. For retailers, that's flexibility. For landlords, it means more lease events — and more chances to review rents and refresh the tenancy mix.

Full analysis in the comments 👇

#CommercialProperty #RetailProperty #SEQ #Arealytics
Read the full analysis: https://www.arealytics.com.au/insight-seq-retail-lease-terms-oct-2026
Will publish at https://www.arealytics.com.au/insight-seq-retail-lease-terms-oct-2026
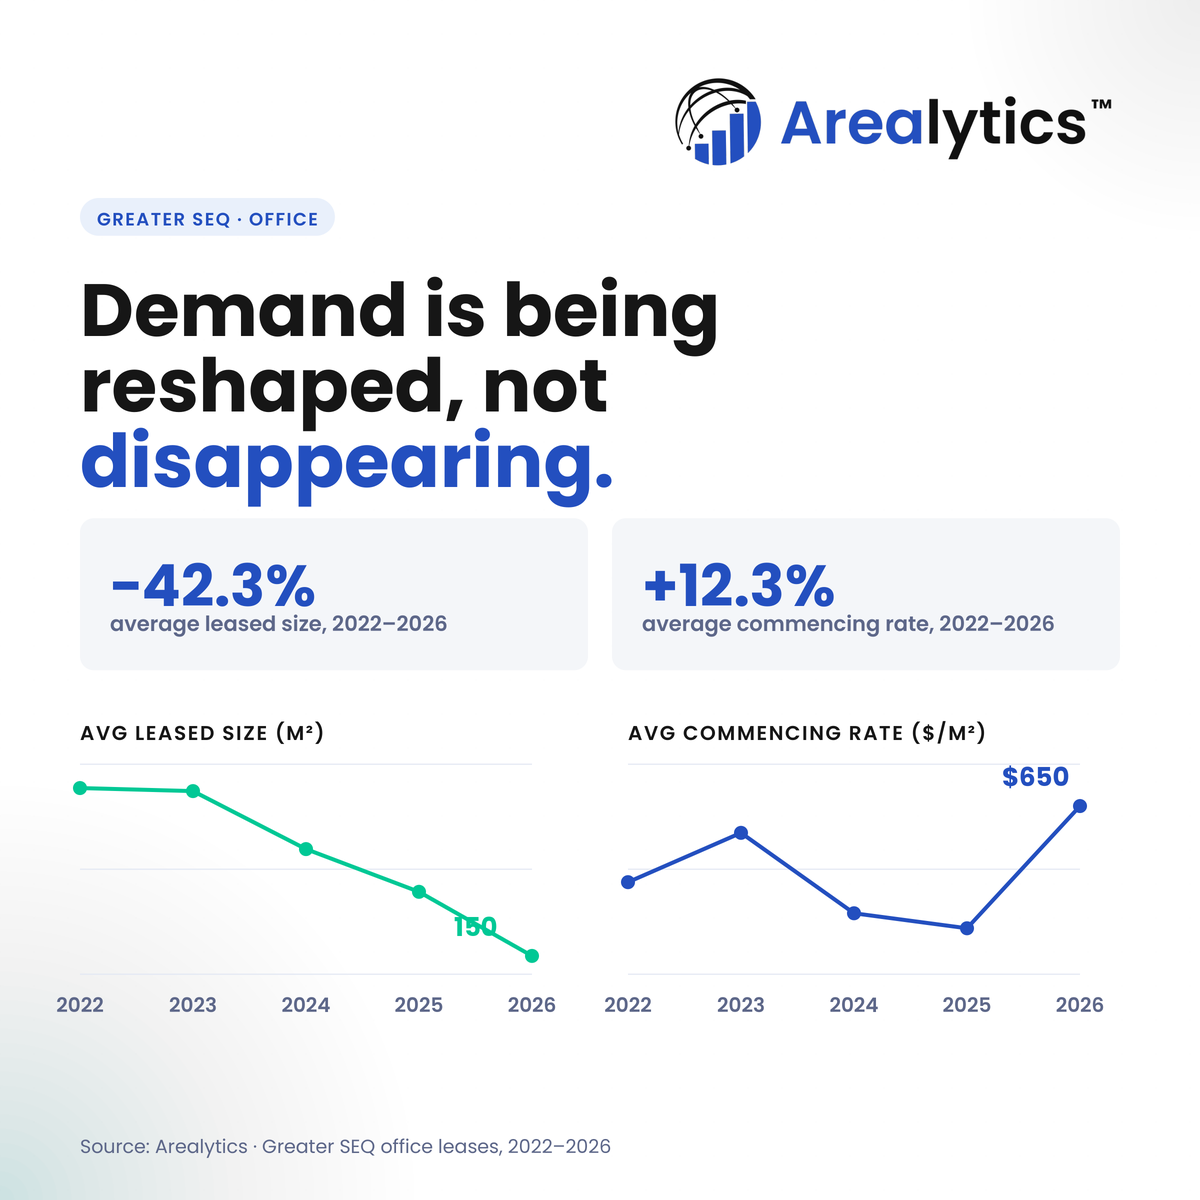
Greater SEQ office demand is being reshaped, not disappearing
Since 2022 the average new office lease in Greater SEQ has shrunk 42.3% to 150 m², while the average commencing rate rose 12.3% to $650/m².
Greater SEQ office occupiers are taking less space — and paying more for it.

Since 2022, the average new office lease has shrunk 42.3%, from 260 m² to 150 m². Over the same period, the average commencing rate rose 12.3%, from $579/m² to $650/m².

That's not a market in retreat. It's a more selective one: right-sized requirements, with demand concentrating in buildings that offer the quality, amenity and location businesses now expect.

Full analysis in the comments 👇

#CommercialProperty #OfficeMarket #SEQ #Arealytics
Read the full analysis: https://www.arealytics.com.au/insight-seq-office-demand-oct-2026
Will publish at https://www.arealytics.com.au/insight-seq-office-demand-oct-2026
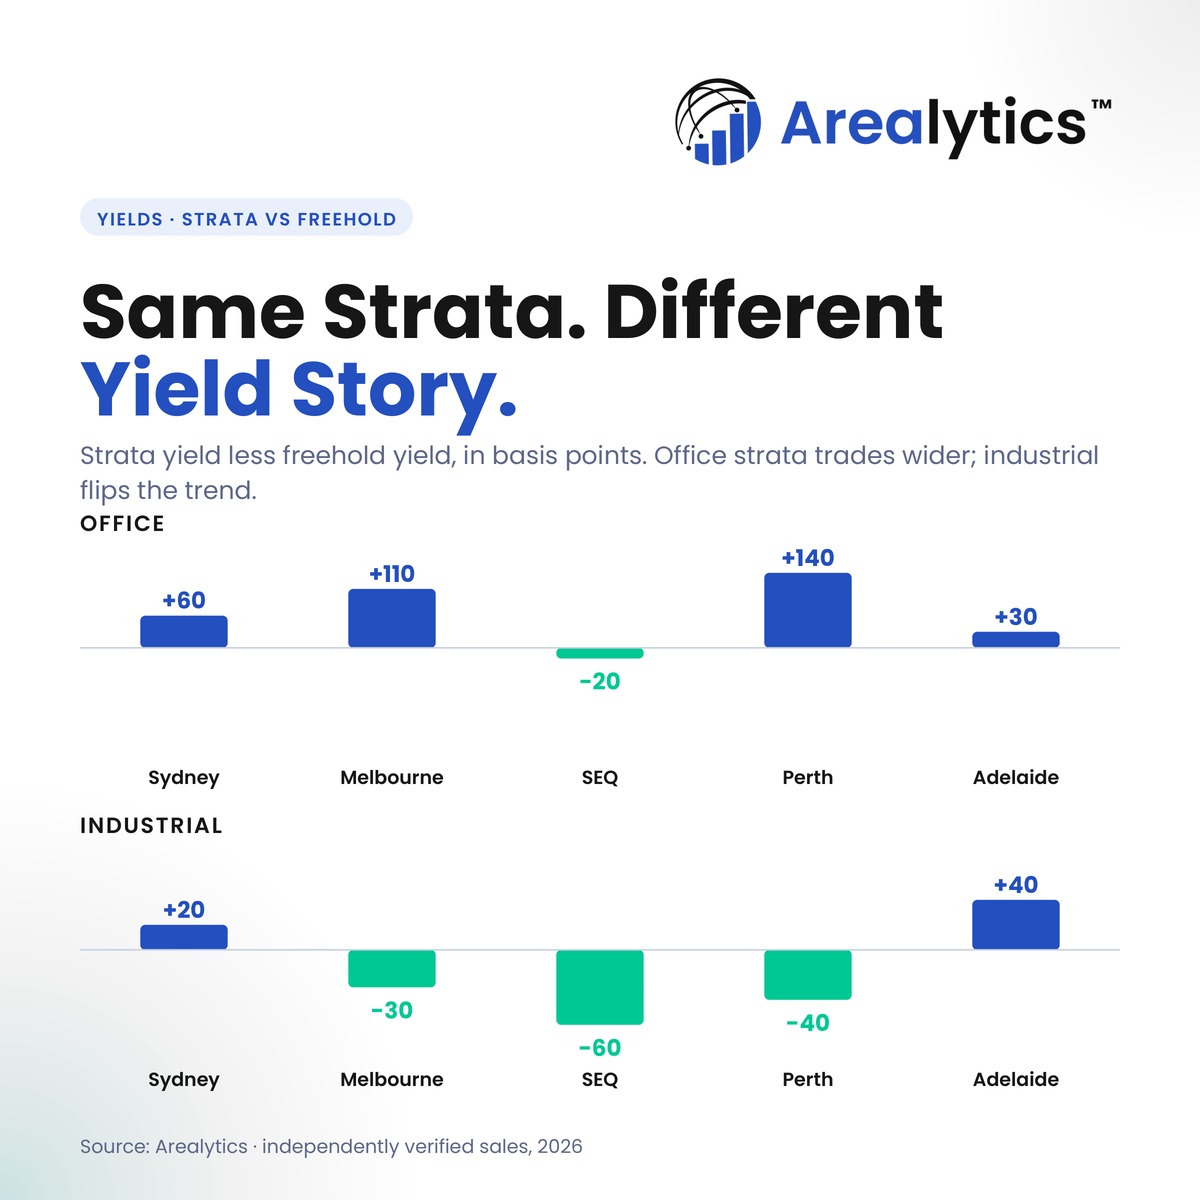
Same strata, different yield story: office and industrial across five markets
Office strata trades at wider yields than freehold in most major markets. Industrial strata does the opposite in SEQ, Perth and Melbourne.
Same ownership structure. Opposite yield stories.

Office strata trades at wider yields than freehold in most major markets: +140 bps in Greater Perth, +110 bps in Greater Melbourne and +60 bps in Greater Sydney.

Industrial flips it. Strata sits 60 bps below freehold in Greater SEQ, 40 bps below in Greater Perth and 30 bps below in Greater Melbourne — supported by strong owner-occupier and private-investor demand.

All five markets in the full analysis, link in the comments 👇

#CommercialProperty #PropertyInvestment #Industrial #Arealytics
Read the full analysis: https://www.arealytics.com.au/insight-strata-freehold-yields-oct-2026
Will publish at https://www.arealytics.com.au/insight-strata-freehold-yields-oct-2026
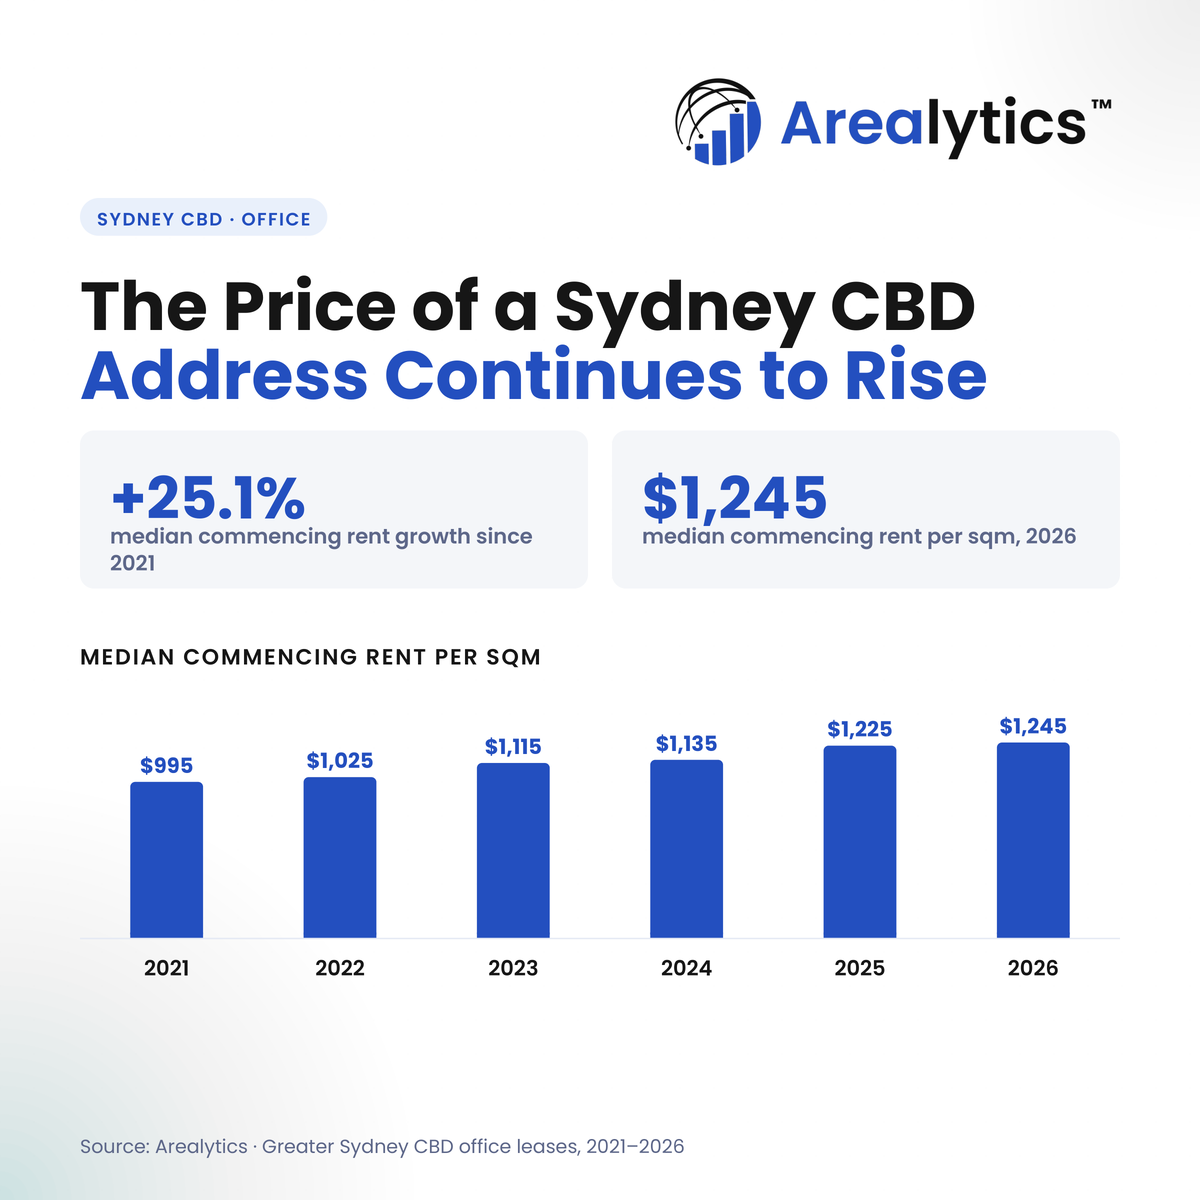
The price of a Sydney CBD address continues to rise
The median commencing office rent in the Sydney CBD has risen every year since 2021, from $995/m² to $1,245/m² in 2026 — up 25.1%.
The price of a Sydney CBD address keeps rising.

The median commencing office rent in the Sydney CBD has increased every year since 2021 — from $995/m² to $1,245/m², up 25.1%.

Growth has come in steps: strong years in 2023 (+8.8%) and 2025 (+7.9%), each followed by a quieter year of consolidation.

Full analysis in the comments 👇

#CommercialProperty #SydneyCBD #OfficeMarket #Arealytics
Read the full analysis: https://www.arealytics.com.au/insight-sydney-cbd-office-rents-oct-2026
Will publish at https://www.arealytics.com.au/insight-sydney-cbd-office-rents-oct-2026
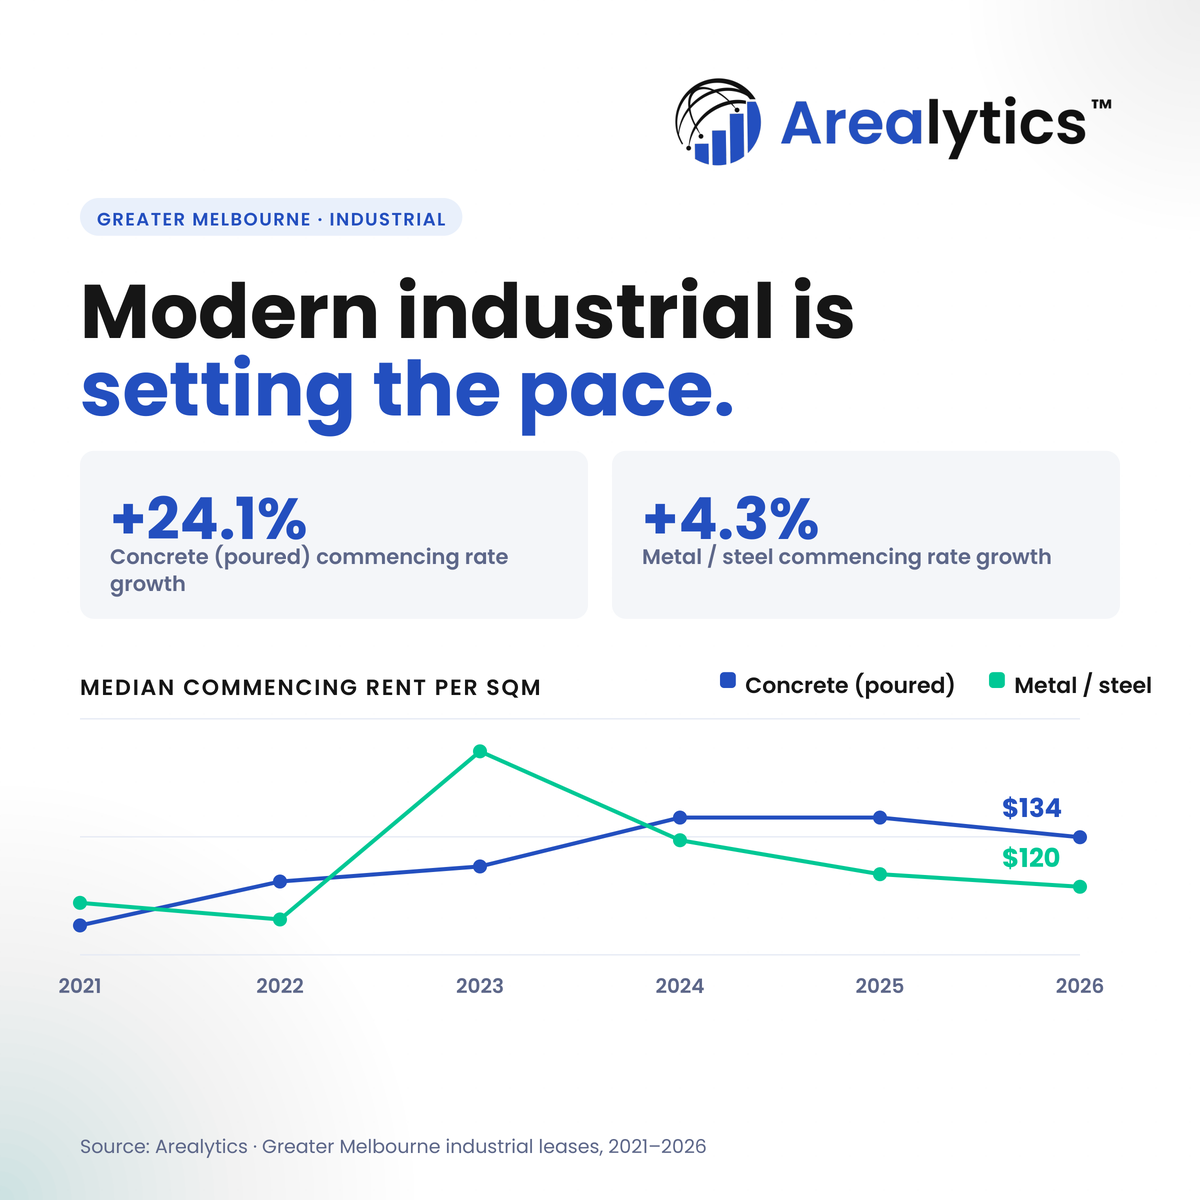
Modern industrial is setting the pace: Melbourne warehouse rents by construction type
Median commencing rents for concrete warehouses in Greater Melbourne rose about 24% from 2021 to 2026. Metal and steel buildings managed about 4%.
Not every industrial building is sharing in Melbourne's rental growth.

Since 2021, the median commencing rent for concrete warehouses in Greater Melbourne has risen about 24%, from $108.24/m² to $134.22/m². Metal and steel buildings? About 4%, to $119.63/m².

In 2021, metal and steel leased at the higher rent. Today concrete leads by around 12%. For valuers and agents, construction type belongs in the choice of comparable evidence.

Full analysis in the comments 👇

#CommercialProperty #IndustrialProperty #Melbourne #Arealytics
Read the full analysis: https://www.arealytics.com.au/insight-melbourne-industrial-construction-rents-oct-2026
Will publish at https://www.arealytics.com.au/insight-melbourne-industrial-construction-rents-oct-2026
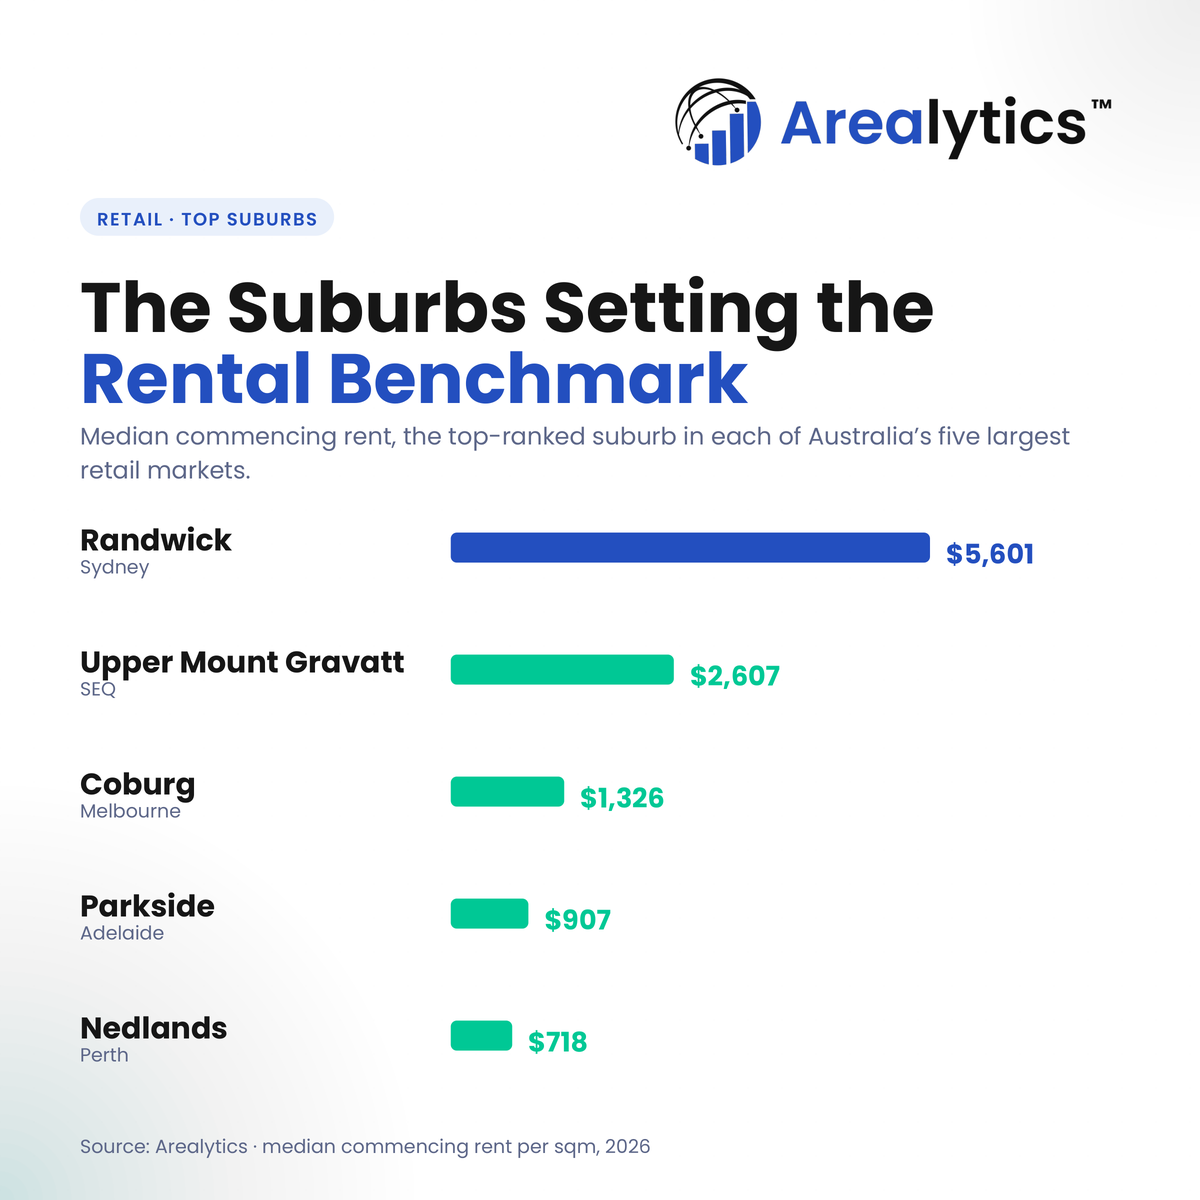
The suburbs setting the retail rent benchmark across Australia’s five largest markets
Randwick, Upper Mount Gravatt, Coburg, Parkside and Nedlands: the suburbs with the highest median commencing retail rents in Australia's five largest markets.
Every retail market has a suburb that sets the benchmark.

The highest median commencing retail rents across Australia's five largest markets:
🥇 Randwick, Greater Sydney — $5,601/m²
Upper Mount Gravatt, Greater SEQ — $2,607/m²
Coburg, Greater Melbourne — $1,326/m²
Parkside, Greater Adelaide — $907/m²
Nedlands, Greater Perth — $718/m²

Randwick sits at around twice the SEQ benchmark, and almost eight times Perth's.

Full analysis in the comments 👇

#CommercialProperty #RetailProperty #Arealytics
Read the full analysis: https://www.arealytics.com.au/insight-retail-rent-benchmark-suburbs-oct-2026
Will publish at https://www.arealytics.com.au/insight-retail-rent-benchmark-suburbs-oct-2026
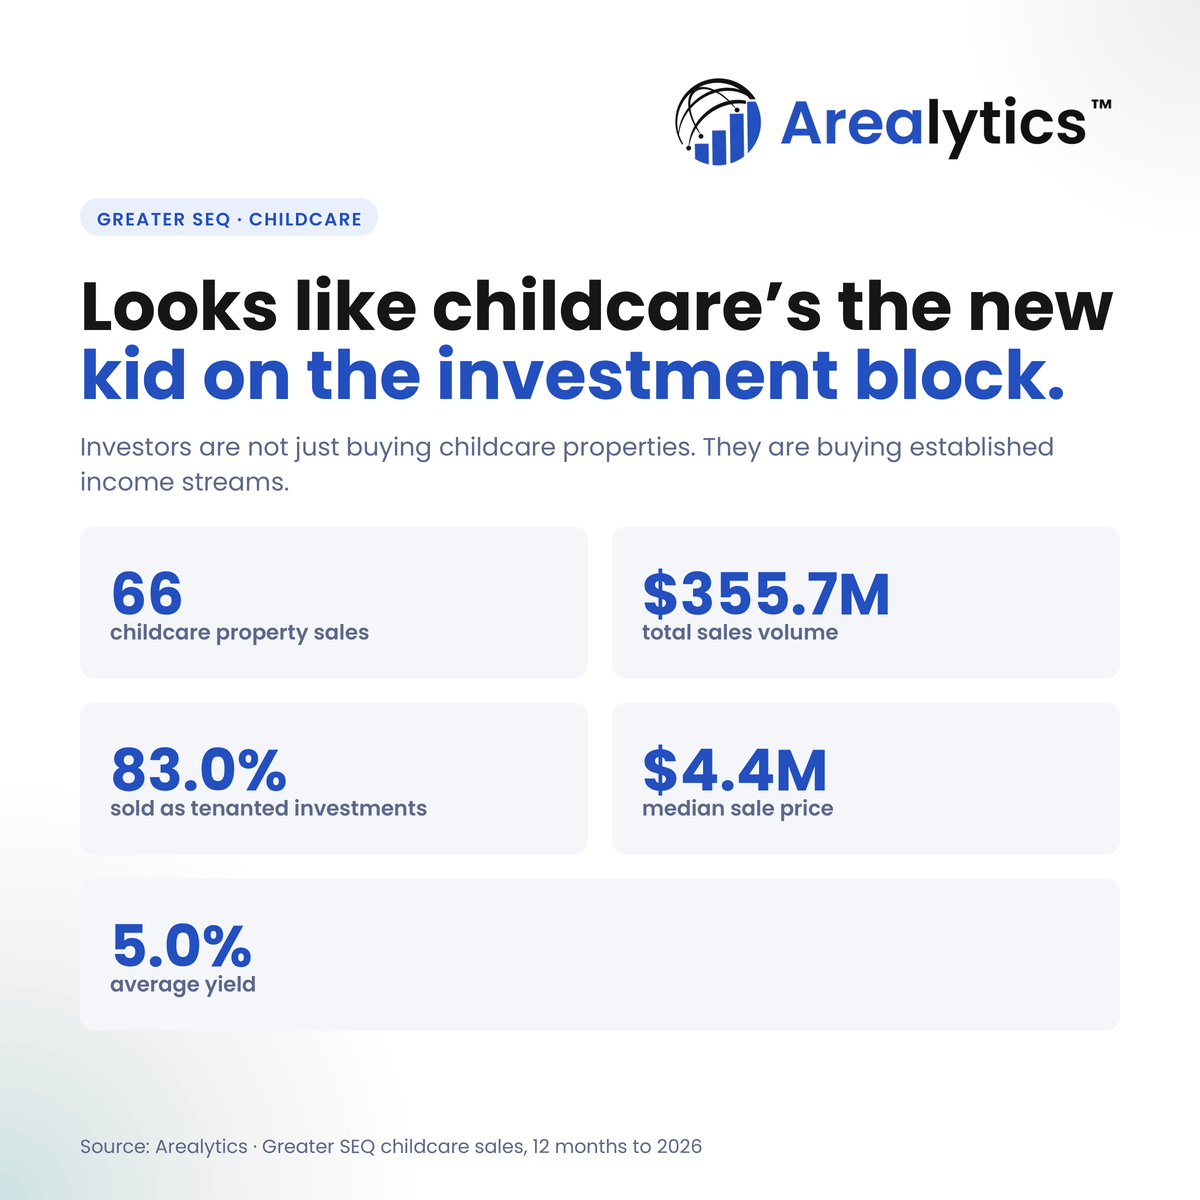
Childcare is the new kid on the investment block in Greater SEQ
66 childcare properties sold across Greater SEQ in the past 12 months, worth $355.7M. 83.0% sold with a tenant in place, at an average 5.0% yield.
Investors aren't just buying childcare properties. They're buying established income.

Across Greater SEQ over the past 12 months:
▪️ 66 childcare property sales
▪️ $355.7M in total sales volume
▪️ 83.0% sold with a tenant already in place
▪️ $4.4M median sale price
▪️ 5.0% average yield

Full analysis in the comments 👇

#CommercialProperty #Childcare #SEQ #PropertyInvestment #Arealytics
Read the full analysis: https://www.arealytics.com.au/insight-seq-childcare-investment-oct-2026
Will publish at https://www.arealytics.com.au/insight-seq-childcare-investment-oct-2026