
2026 Company Overview
Building Data,
everywhere.
Advanced real estate analytics — sourcing, verifying and maintaining the commercial property data that powers Australia's leasing and investment markets.
Arealytics · 2026

Company Timeline
The Journey
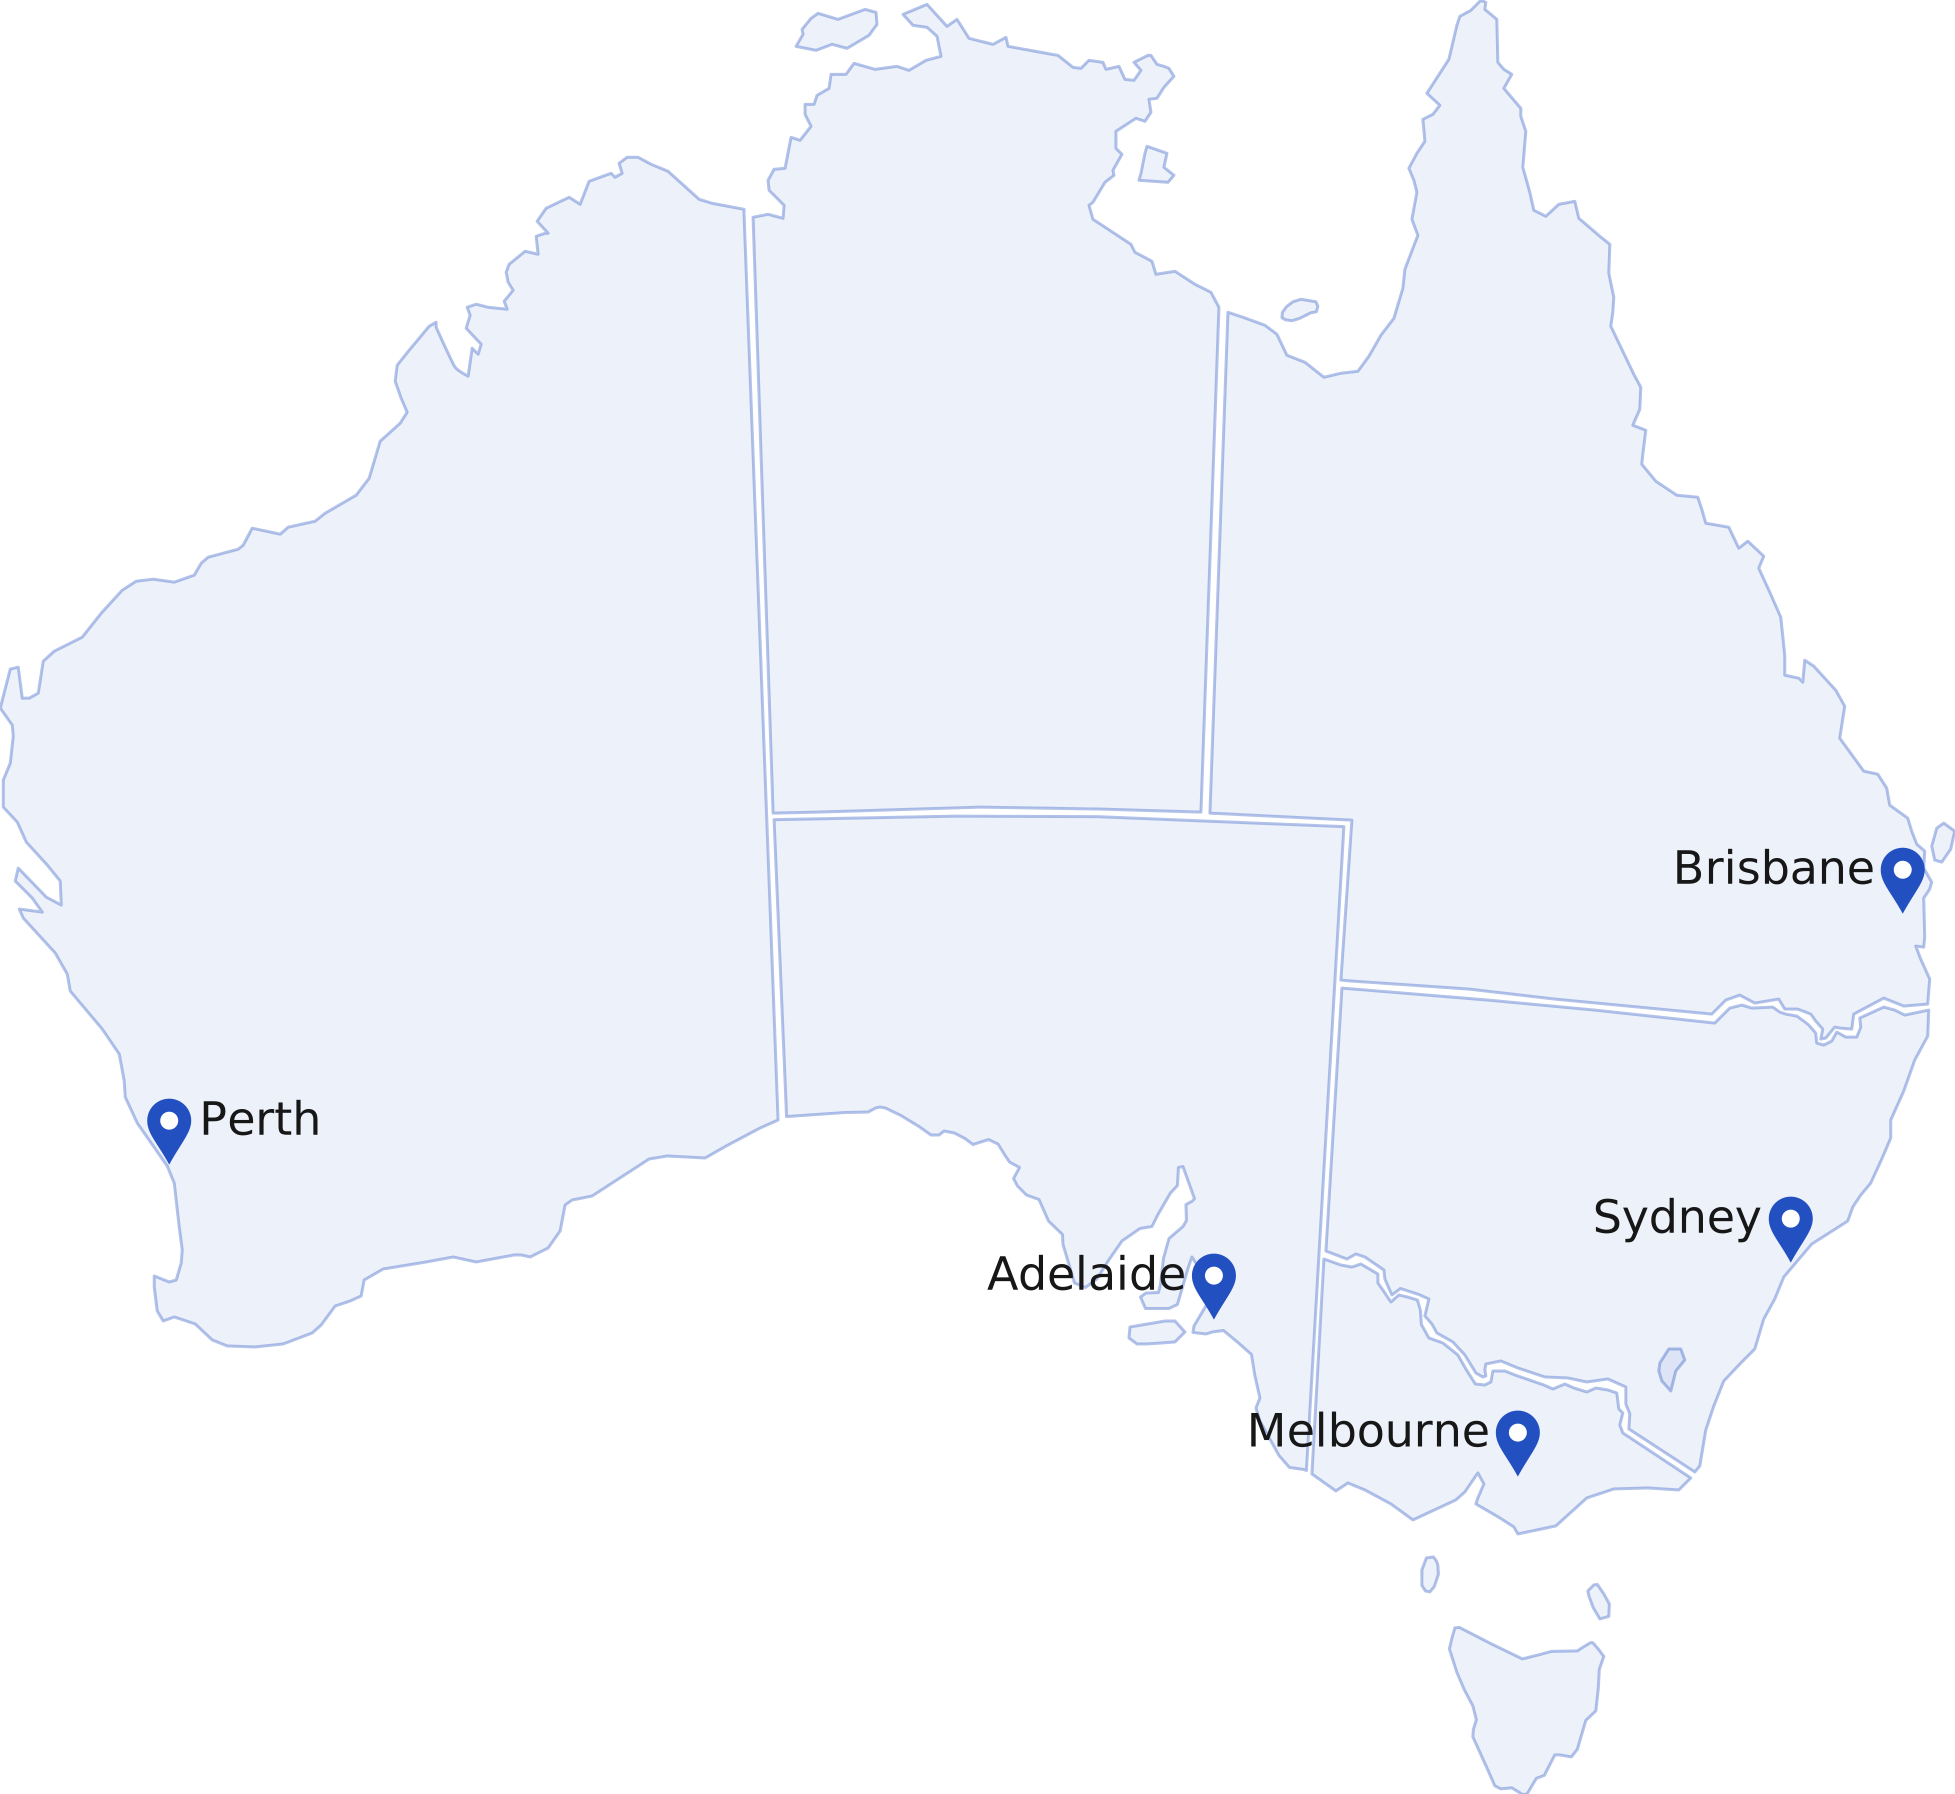
- 2018Founded Arealytics
- 2019Launched Sydney
- 2022Launched Melbourne
- 2023REA joins as investor
- 2024Launched Brisbane
- 2025Launched Perth
- 2026Launched Adelaide
Source: Arealytics Company Records
02
Foundation 01
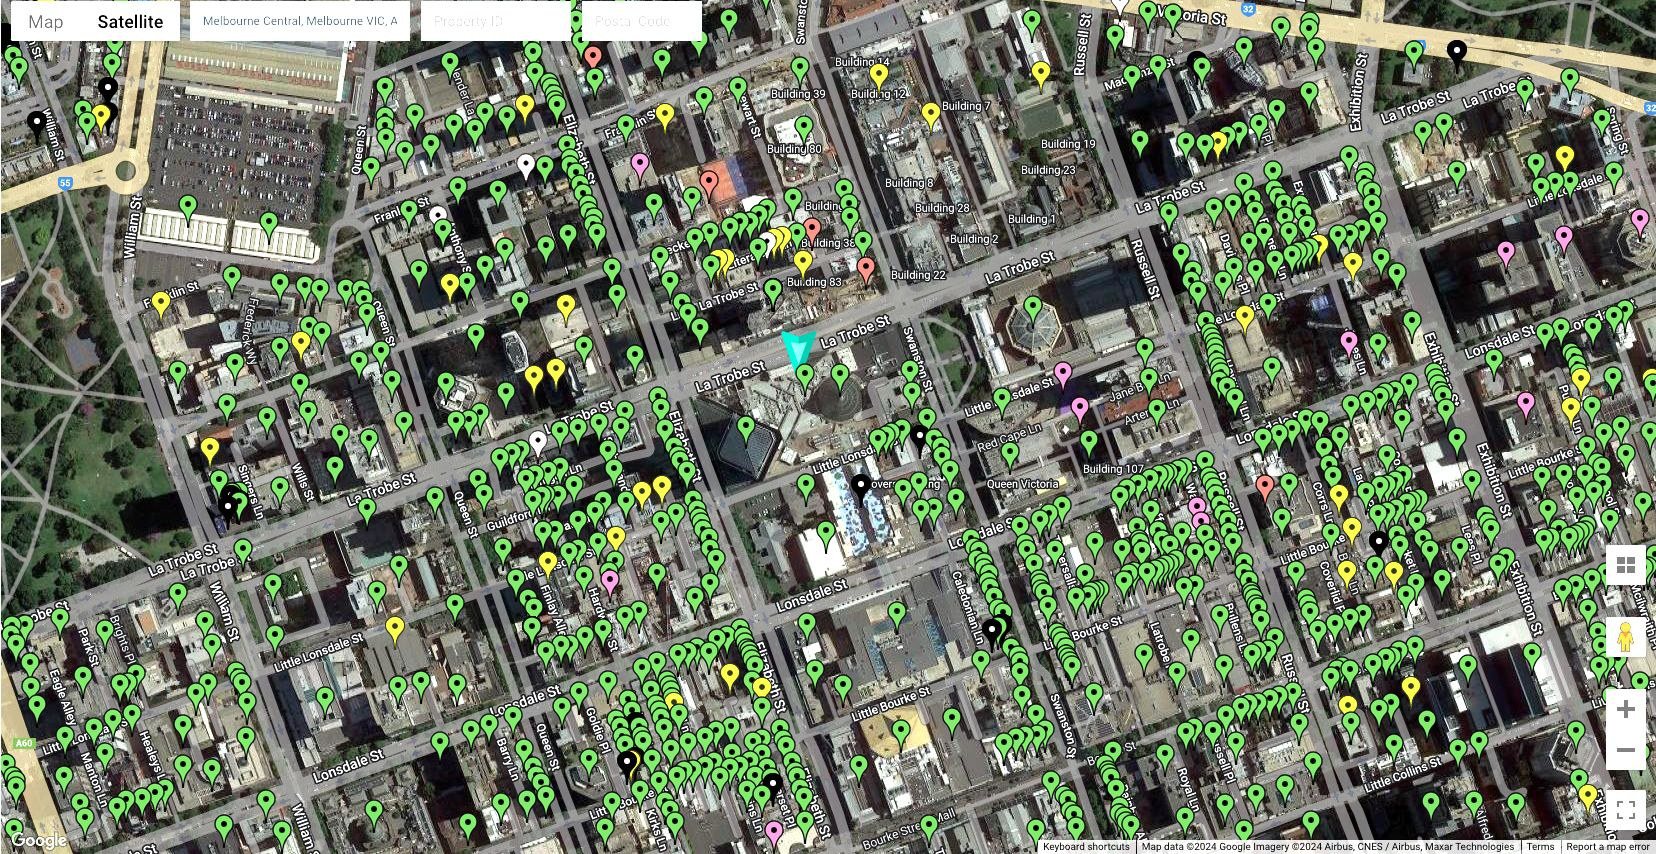
Creating a Property Universe.
Geocoded properties
Gross Building Area (GBA)
Asset type
Physical characteristics
Building size estimates
04
Foundation 02
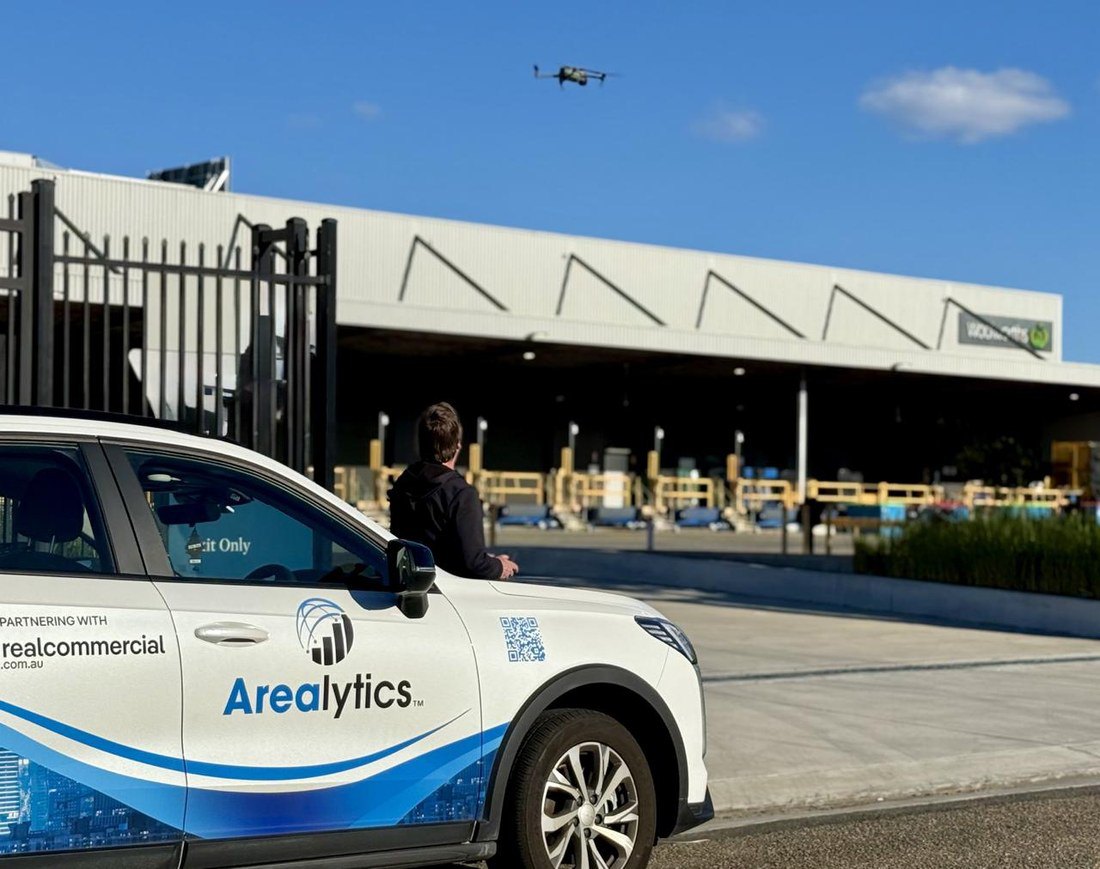
On-Site Property Inspections.
Original building photos
Tenant directories
Detailed property characteristics
Signboards
05
Foundation 03
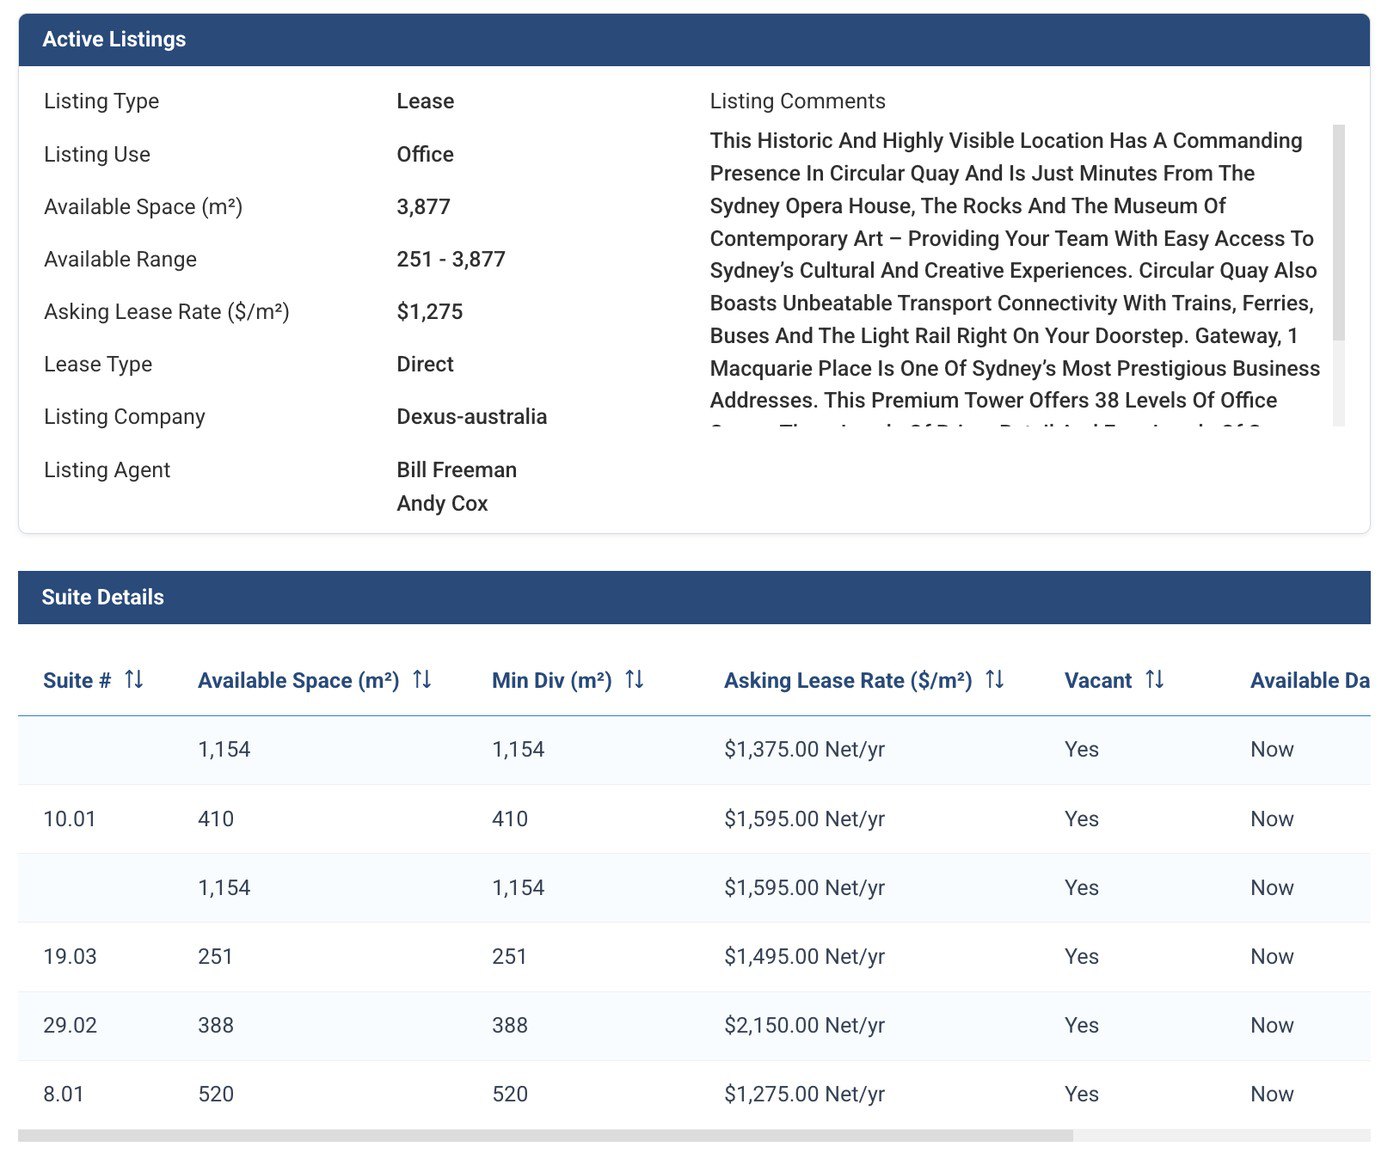
Listing Research.
For Sale & For Lease www.realcommercial.com.au Listing Feed
Suite build out
Weekly updates
06
Foundation 04
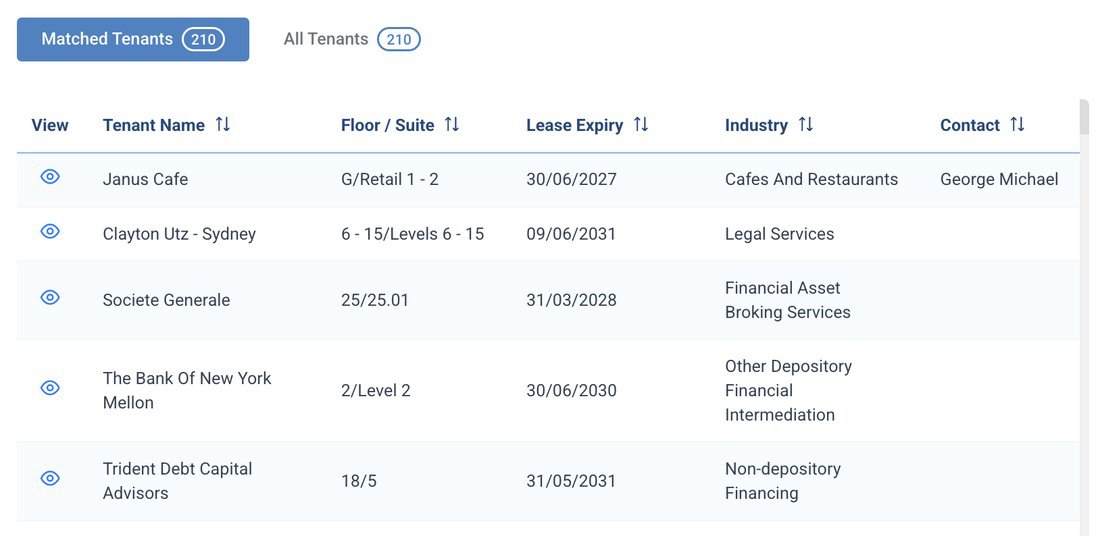
Tenant Research.
Comprehensive 3rd-party data
Lease transaction linking
07
Foundation 05
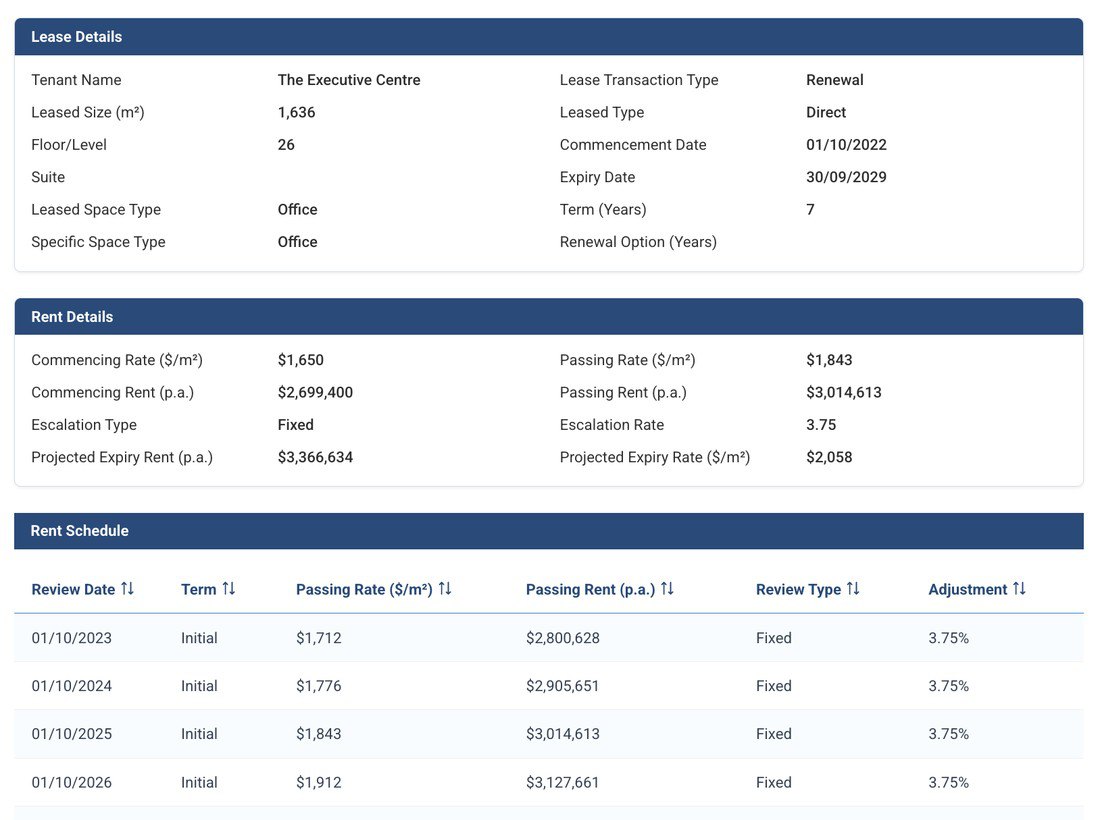
Lease Transactions.
Registered leases
Exclusive confirmed leases
Monitoring systems
08
Foundation 06
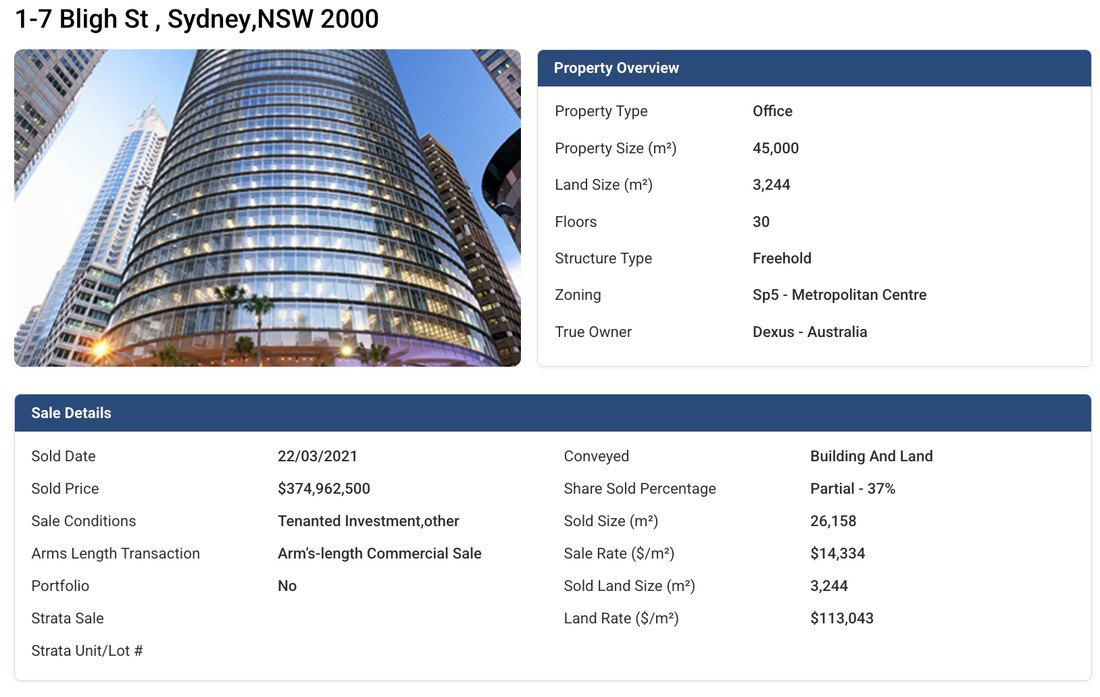
Sales Transactions & Ownership.
Valuer General data
Enrichment process
True buyer & seller
Owner portfolio view
09
Setting a new standard
1
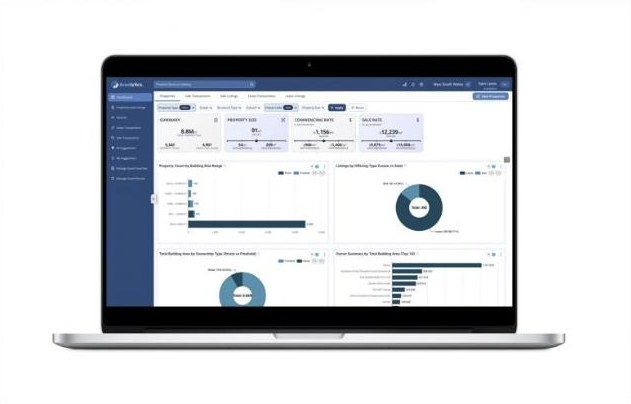
Real-time analytics — dashboards on field-verified data
2
Interactive mapping — leases, sales & ownership together
3
Unified prospecting — tenant & business detail in one view
4
Custom feeds — market updates as they happen
"The competitive edge isn't just having data — it's the speed at which you can interpret it."— David O'Rell, Chief Product Officer
11
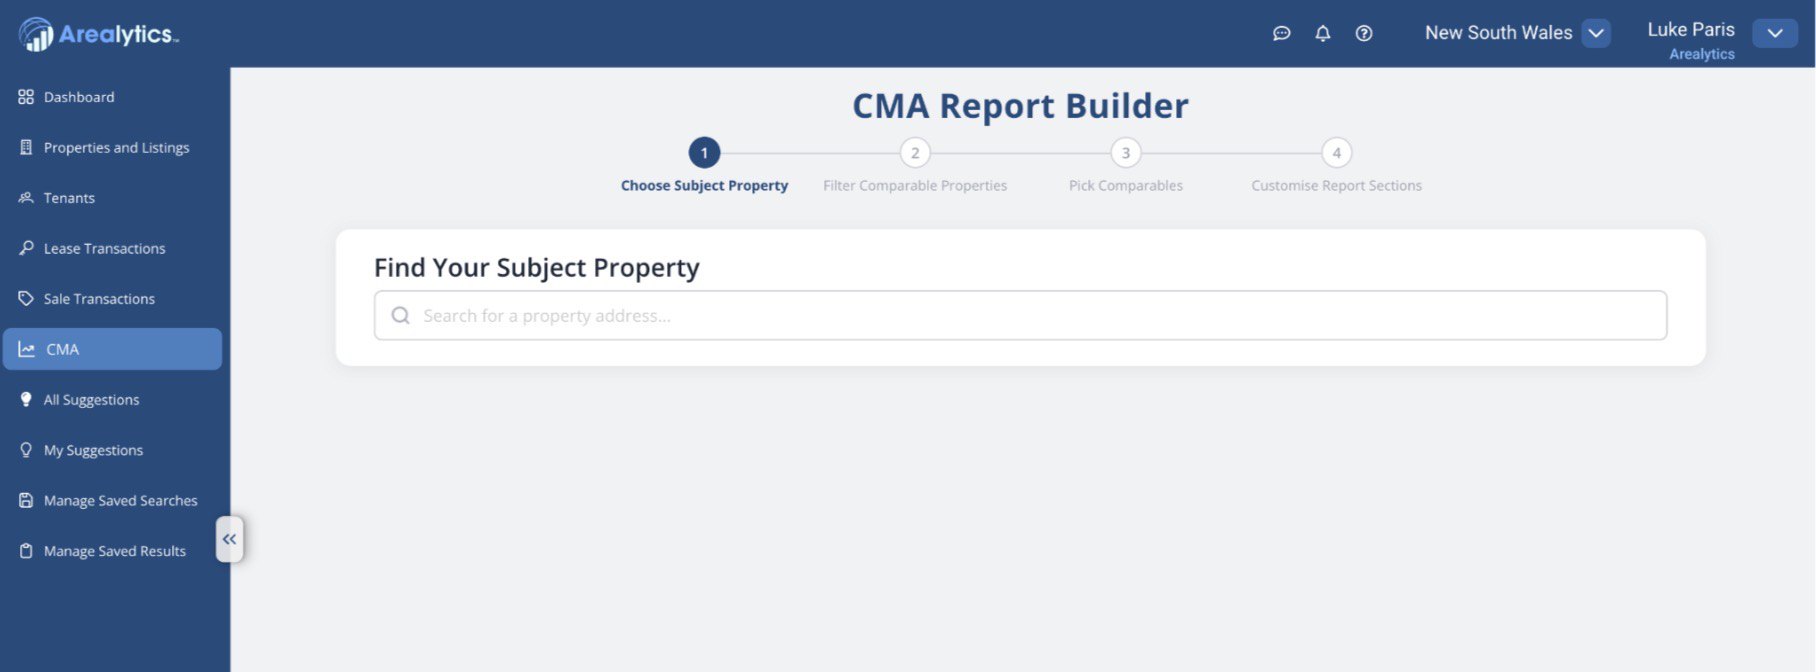
An industry-first CMA workflow
1
Automated aggregation — sales, leases & listings centralised
2
Configurable output — built specifically for CRE
3
Real-time analysis — visualise the market as it moves
4
Decision engine — from data repository to decisions
"A fundamental shift in our product philosophy — helping clients win business and serve their clients more effectively."— Doug Curry, CEO
12
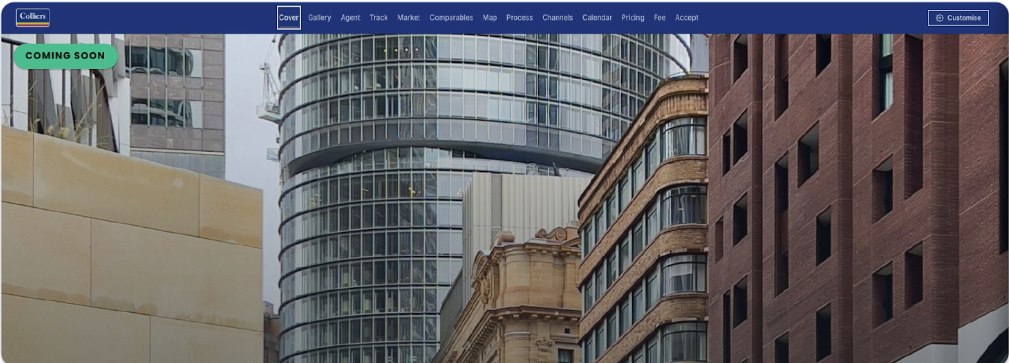
Introducing Digital Proposals
Branded, interactive cover
Live market data & pricing
Client view tracking
Built-in e-signature
13
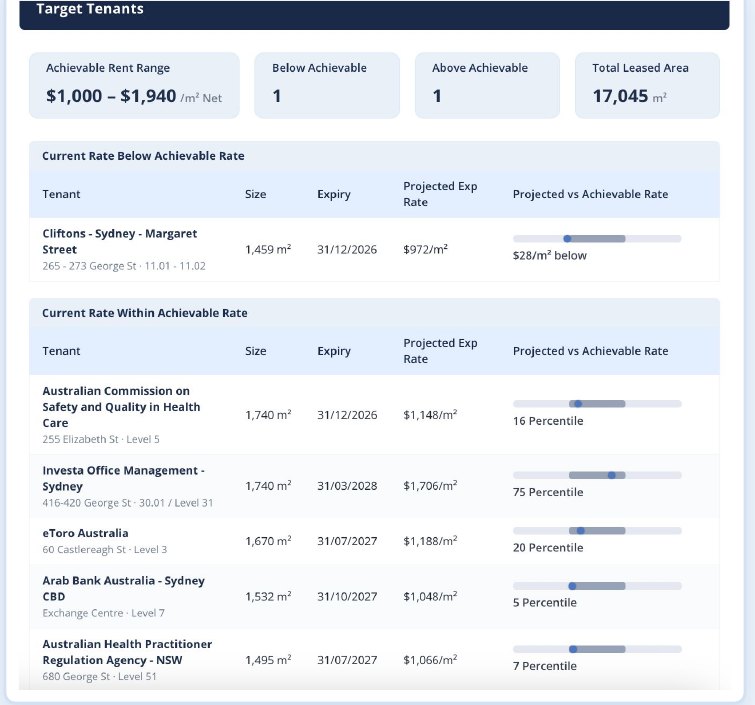
Introducing the Lease Insights Tool
1Title page — property address, agency branding, date prepared
2Cover letter — auto-drafted from the property and market data
3Recent lease evidence — selected comparables with rate and size detail
4Target tenants — expiring tenants grouped by reversion classification
5Competitive listings — active listings with asking rate and rate position
6Map — the subject property and surrounding evidence
7Conclusion — market observations and recommended rent range
14
National data snapshot
Total property universe
Total assets tracked
481,948
Commercial assets across Office, Industrial, Retail & Other — freehold and strata, five markets.
215,684 Freehold · 44.8%266,264 Strata · 55.2%
81,993
Office
17.0%
180,933
Industrial
37.5%
109,344
Retail
22.7%
109,678
Other
22.8%
Source: Arealytics Property Data
16
National data snapshot
Total lease universe
Total leases tracked
178,329
Active and historic lease transactions across Office, Industrial, Retail & Other, five markets.
70,145 Active · 39.3%108,184 Historic · 60.7%
54,411
Office
30.5%
74,246
Industrial
41.6%
42,395
Retail
23.8%
7,277
Other
4.1%
Source: Arealytics Lease Data
17
National data snapshot
Total sales universe
Total sales tracked
683,210
Sale transactions across Office, Industrial, Retail & Other — Sydney, Melbourne, SE Queensland, Perth & Adelaide.
Source: Arealytics Sales Data
18
Important · Please Read
Disclaimer.
This presentation is for general informational purposes only. It is not a commitment to deliver any material, code or functionality, and should not be relied upon in making any purchasing decisions. The development, release and timing of any features or functionality described in this document remains at the sole discretion of Arealytics.
This document contains proprietary information that is the exclusive property of Arealytics and may not be disclosed, copied, reproduced or distributed to anyone outside Arealytics without prior written consent. This document is not part of any agreement with Arealytics, nor can it be incorporated into any contractual agreement with Arealytics or any of its affiliated partners or companies.
19
Thank you
Building Data,
everywhere.
www.arealytics.com.au